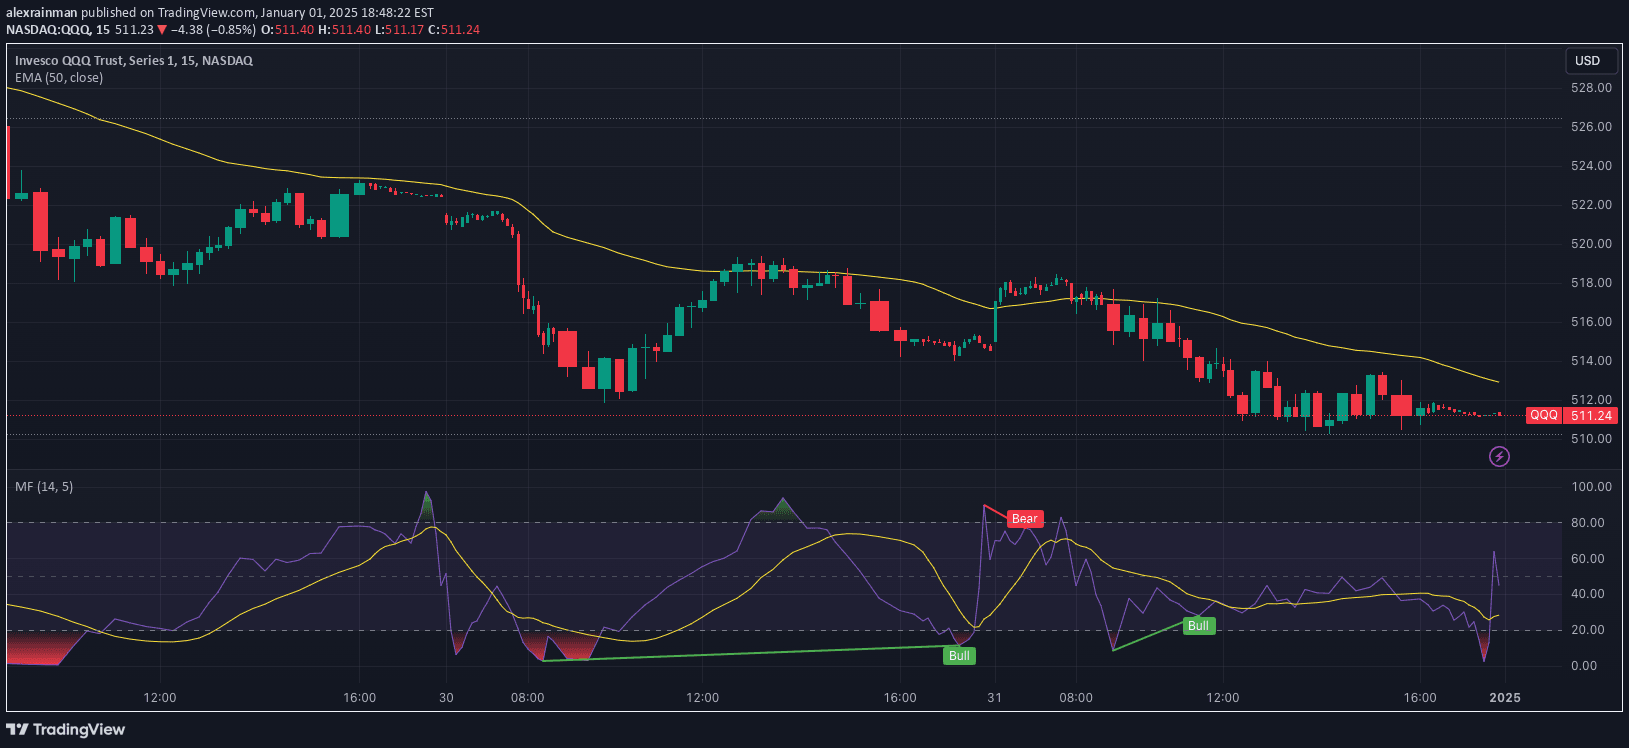
A multi-signal RSI indicator that provides six different entry and exit strategies based on Relative Strength Index movements, helping traders identify potential trading opportunities.
Explore complementary indicator rolesHow it works
The RSI indicator generates signals through multiple methods including tracking overbought and oversold zones, identifying level crossings, and analyzing momentum through moving average interactions. It provides six distinct signal types: entry and exit in extreme zones, 50-level crossings, moving average crossovers, and divergence detection.
Traders can customize stop loss and take profit strategies using percentage-based or Average True Range (ATR) methods. The indicator simultaneously displays RSI in the bottom chart and signals, stop loss, and take profit levels in an overlay chart, enabling quick and comprehensive trade management.
Why it may be useful
RSI signals offer crucial insights into market momentum and potential trend reversals by measuring the speed and magnitude of price movements. By identifying overbought and oversold conditions, traders can make more informed decisions about potential entry and exit points, reducing emotional trading and enhancing strategic precision.
The multi-signal approach provides traders with versatile analysis tools, allowing them to adapt strategies to different market conditions. The ability to customize stop loss and take profit levels further enhances risk management, helping traders protect capital and optimize potential returns.
When to explore it
The RSI indicator works best in trending and range-bound markets, providing valuable signals during periods of price consolidation and potential momentum shifts. Traders should use these signals in conjunction with other technical analysis tools to confirm potential trade setups and reduce false signals.
The indicator is particularly effective in markets with clear cyclical patterns and when price is oscillating between support and resistance levels. Traders should pay special attention to divergence signals and zone crossings, which can indicate potential trend reversals or continuation patterns.
Keep exploring
What we’ve verified
Access, alerts and repainting behaviour have not been independently verified for this indicator. Check the creator’s current publication and settings.
General descriptions and classifications are recovered research. Verified details above identify the specific checks we have completed. Check the creator’s current publication for later changes.