YOUR INDICATOR RESEARCH STARTS HERE

Find the right indicator.
Understand what it does.

Explore 11,183 indicators. Filter beyond the obvious.
Discover the tools that fit the way you trade.

THE INDICATOR LIBRARY

Results for “power”

11,183 tools to explore

159 indicators matching your filters
Save search
TrendMomentum

ADX and DI

by BeikabuOyaji

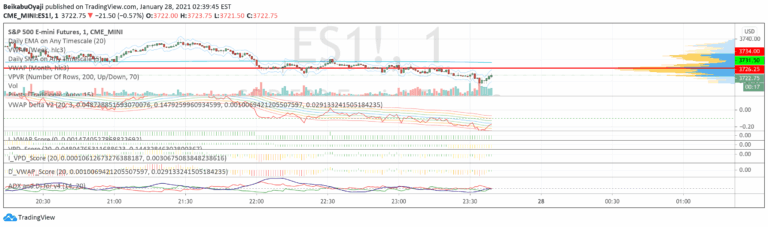
ADX measures trend strength and direction by analyzing price movement. It helps traders identify the presence and power of a trend, indicating whether a market is trending or ranging.

Separate paneDay Trading · Swing Trading
Explore
41.3Klikes785Kviews128comments
Save
LevelsSignal

OA S/R Power

by onurag

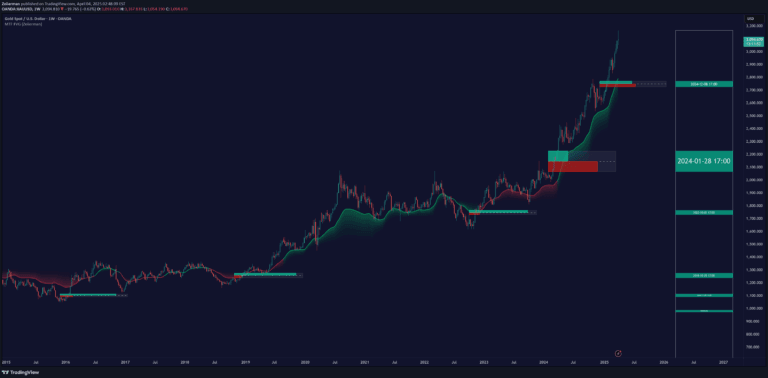
A dynamic support and resistance level indicator that scores potential trading zones based on volume, bounce frequency, and price interactions, providing visual insights into market structure.

Main price chart · unverifiedScalping · Day Trading
Explore
3.3Klikes48.4Kviews24comments
Save
MomentumSignal

Burst Power

by finallynitin

A trading indicator analyzing stock price movements to calculate a Burst Power score, revealing potential for significant price bursts within Indian market stocks.

Separate pane · unverifiedDay Trading · Swing Trading
Explore
2.1Klikes22.2Kviews15comments
Save
TrendMomentumEditor’s pick

Polynomial Regression Bands + Channel [DW]

by DonovanWall

A polynomial regression indicator that calculates complex curve-fitting relationships between price variables, enabling advanced trend analysis and least squares moving average (LSMA) generation.

Main price chart · unverifiedDay Trading · Swing Trading
Explore
2Klikes61.6Kviews42comments
Save
VolumeTrendEditor’s pick

#NAME?

by ClassicScott

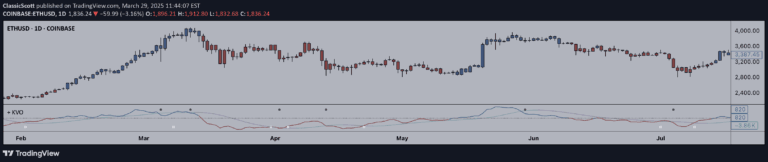
The Klinger Oscillator is a volume-based technical indicator that compares price changes and volume to determine potential trend reversals and market momentum.

Separate pane · unverifiedDay Trading · Swing Trading
Explore
1.9Klikes62.3Kviews40comments
Save
LevelsSignal

Support/Resistance Strength [UAlgo]

by UAlgo

A dynamic support and resistance indicator that identifies key market levels using pivot points and customizable strength criteria to help traders make informed trading decisions.

Main price chart · unverifiedScalping · Day Trading
Explore
1.7Klikes27.4Kviews4comments
Save

Likes, views, and comments are historical TradingView snapshots. They describe attention, not trading performance.

START WITH A QUESTION

A little less searching.
A lot more understanding.

Tell DeepAlpha what you need. Get an explanation, a shortlist,
and a direct path to the indicators behind it.

Ask DeepAlpha