
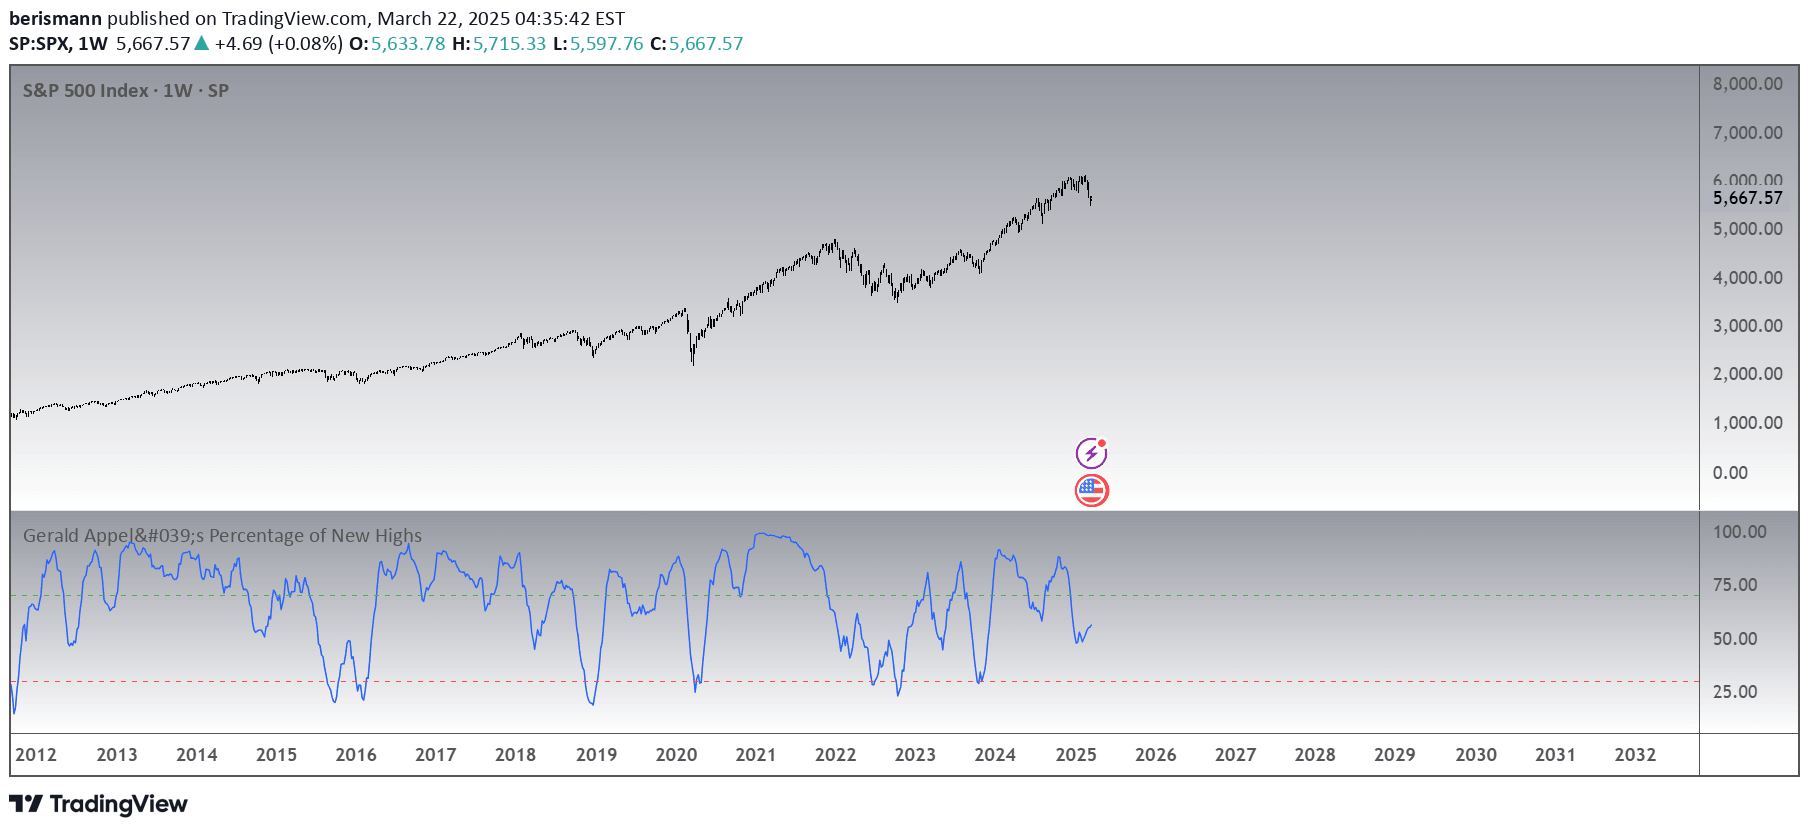
The Percentage of New Highs Indicator reveals market strength by calculating the ratio of new highs to total market highs and lows. It helps identify potential trend reversals and market weakness.
Explore complementary indicator rolesHow it works
The indicator calculates a 10-day moving average of new highs divided by the total number of highs and lows in the market. It creates a percentage-based metric that oscillates between 0% and 100%. When the indicator moves above 70%, it suggests strong market momentum and bullish sentiment.
Conversely, when it drops below 30%, it indicates potential market weakness or oversold conditions. The moving average smooths out daily fluctuations, providing a more stable view of market participation and strength. Traders use this ratio to understand underlying market dynamics beyond simple price movements
Why it may be useful
This indicator offers unique insights into market breadth and participation that raw price charts cannot reveal. By tracking the proportion of stocks making new highs versus total market activity, traders gain a broader perspective on market health. It helps identify potential trend exhaustion before price reversals become apparent.
The signal can warn of weakening momentum even when prices might still appear strong. It provides a nuanced view of market internals, helping traders make more informed decisions about potential trend changes. Understanding market breadth can be crucial for timing entry and exit points
When to explore it
The Percentage of New Highs Indicator works best in trending markets with clear directional movement. It is particularly useful during swing trading scenarios where identifying trend strength and potential reversals is critical. Traders should apply this indicator in markets with substantial liquidity and diverse stock participation.
It performs well when analyzing broader market indices or sector-specific movements. The signal is most effective when combined with other technical indicators for confirmation. During periods of high market volatility, the indicator can provide additional context about underlying market dynamics. Avoid using it in choppy, range-bound markets with limited directional clarity
Keep exploring
What we’ve verified
Access, alerts and repainting behaviour have not been independently verified for this indicator. Check the creator’s current publication and settings.
General descriptions and classifications are recovered research. Verified details above identify the specific checks we have completed. Check the creator’s current publication for later changes.





