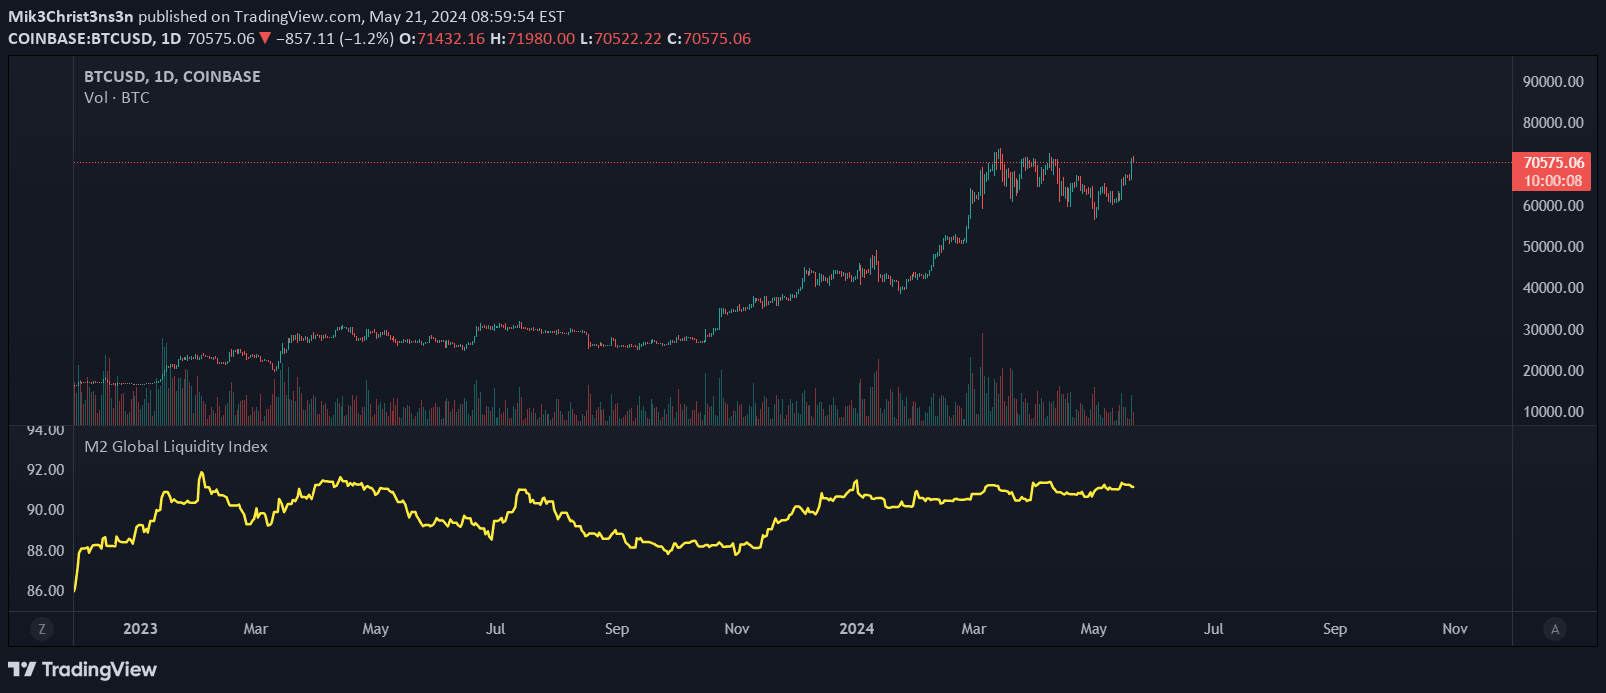
Global Net Liquidity tracks worldwide central bank assets and liquidity, providing insights into market trends through a color-coded moving average cloud indicator.
Explore complementary indicator rolesHow it works
The Global Net Liquidity indicator calculates worldwide net liquidity by combining central bank assets from the Fed, Japan, China, UK, and ECB, then subtracting reverse repurchase agreements and treasury general account. It uses a moving average to create a color-coded cloud that represents the current market trend and potential accumulation or distribution phases.
The indicator applies color coding to visualize market dynamics: blue indicates accumulation, red suggests distribution, and yellow represents an undecided trend. The size of the cloud represents the strength of the current market tendency, with larger clouds indicating more significant departures from recent market behavior.
Why it may be useful
This indicator provides traders with a comprehensive view of global liquidity and market sentiment by aggregating central bank asset data. It offers a unique perspective on market dynamics that goes beyond traditional price-based analysis, helping traders understand the underlying financial ecosystem.
By visualizing accumulation and distribution phases, traders can gain insights into potential market movements and assess the sustainability of current price trends. The color-coded cloud helps traders quickly interpret market conditions and make more informed decisions about entry, exit, and risk management strategies.
When to explore it
The Global Net Liquidity indicator is most effective during periods of significant economic transitions or when analyzing broader market trends across multiple asset classes. It works best for traders seeking a macro perspective on market conditions and wanting to understand the broader financial landscape.
Traders should use this indicator in conjunction with other technical and fundamental analysis tools to confirm signals and develop more robust trading strategies. It is particularly useful for understanding market momentum, identifying potential trend reversals, and assessing the overall health of global financial markets.
Keep exploring
What we’ve verified
Access, alerts and repainting behaviour have not been independently verified for this indicator. Check the creator’s current publication and settings.
General descriptions and classifications are recovered research. Verified details above identify the specific checks we have completed. Check the creator’s current publication for later changes.