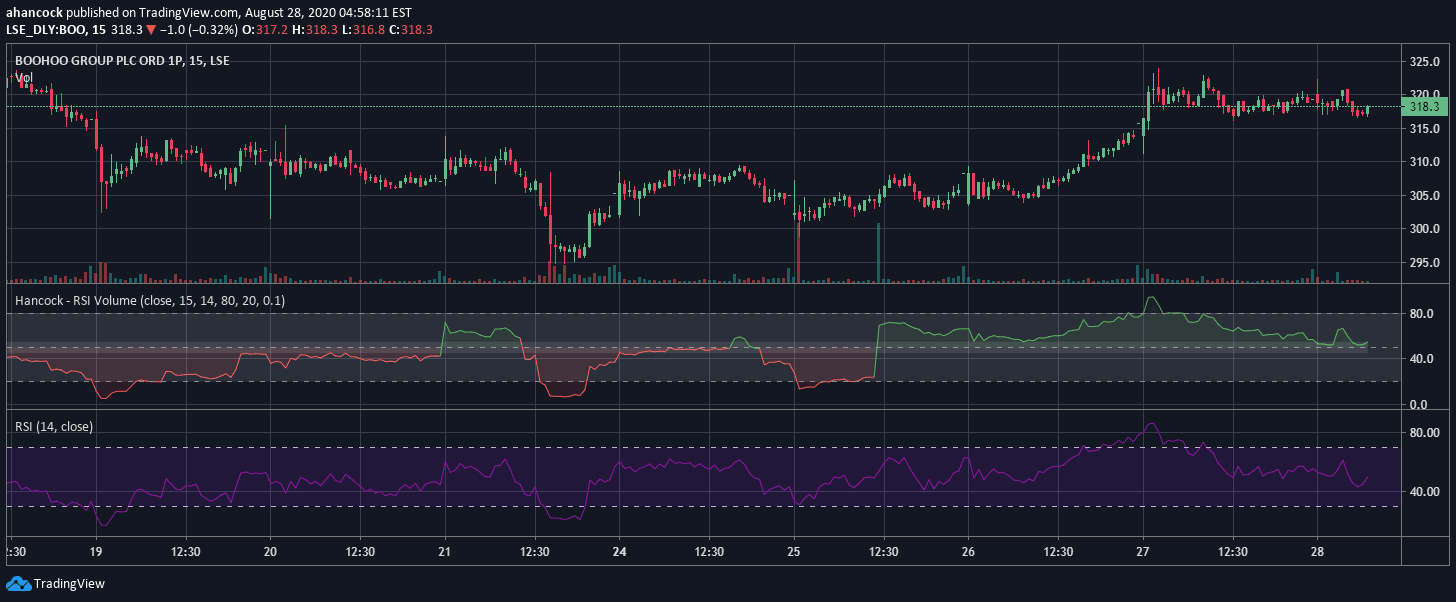
Volume RSI is an advanced indicator that analyzes the strength of bullish and bearish volume flows by comparing up-volume and down-volume within a specific trading period.
Explore complementary indicator rolesHow it works
The Volume RSI calculates the relative strength of buy and sell volume using a configurable lower time-frame. It examines the volume traded during price up-moves and down-moves, tracking the balance between bullish and bearish money flow.
By analyzing each candle's buy and sell volume, the indicator computes a Volume RSI value that reveals whether up-volume or down-volume is dominant. The calculation follows a similar formula to the traditional RSI but replaces price changes with volume data. This approach provides insights into volume dynamics beyond traditional price-based momentum indicators
Why it may be useful
Volume RSI offers traders a nuanced perspective on market momentum by focusing on volume patterns rather than just price movements. It helps identify potential trend reversals and confirm existing market trends through volume analysis. Traders can use this indicator to understand underlying market sentiment and distinguish between genuine trend movements and potential false signals.
By revealing the strength of buying and selling pressure, Volume RSI provides additional context to price action. This makes it a valuable tool for traders seeking more comprehensive market analysis beyond traditional price-based indicators
When to explore it
Volume RSI works best in markets with significant trading volume and clear price trends. It is particularly effective during trending markets where volume can confirm or challenge price movements. Traders should use this indicator in liquid markets like major stock indices, forex pairs, and heavily traded cryptocurrencies.
It is most reliable when combined with other technical indicators to validate signals. The indicator is especially useful during market transitions, breakouts, and potential trend reversals. Traders should pay close attention to divergences between Volume RSI and price action
Keep exploring
What we’ve verified
Access, alerts and repainting behaviour have not been independently verified for this indicator. Check the creator’s current publication and settings.
General descriptions and classifications are recovered research. Verified details above identify the specific checks we have completed. Check the creator’s current publication for later changes.