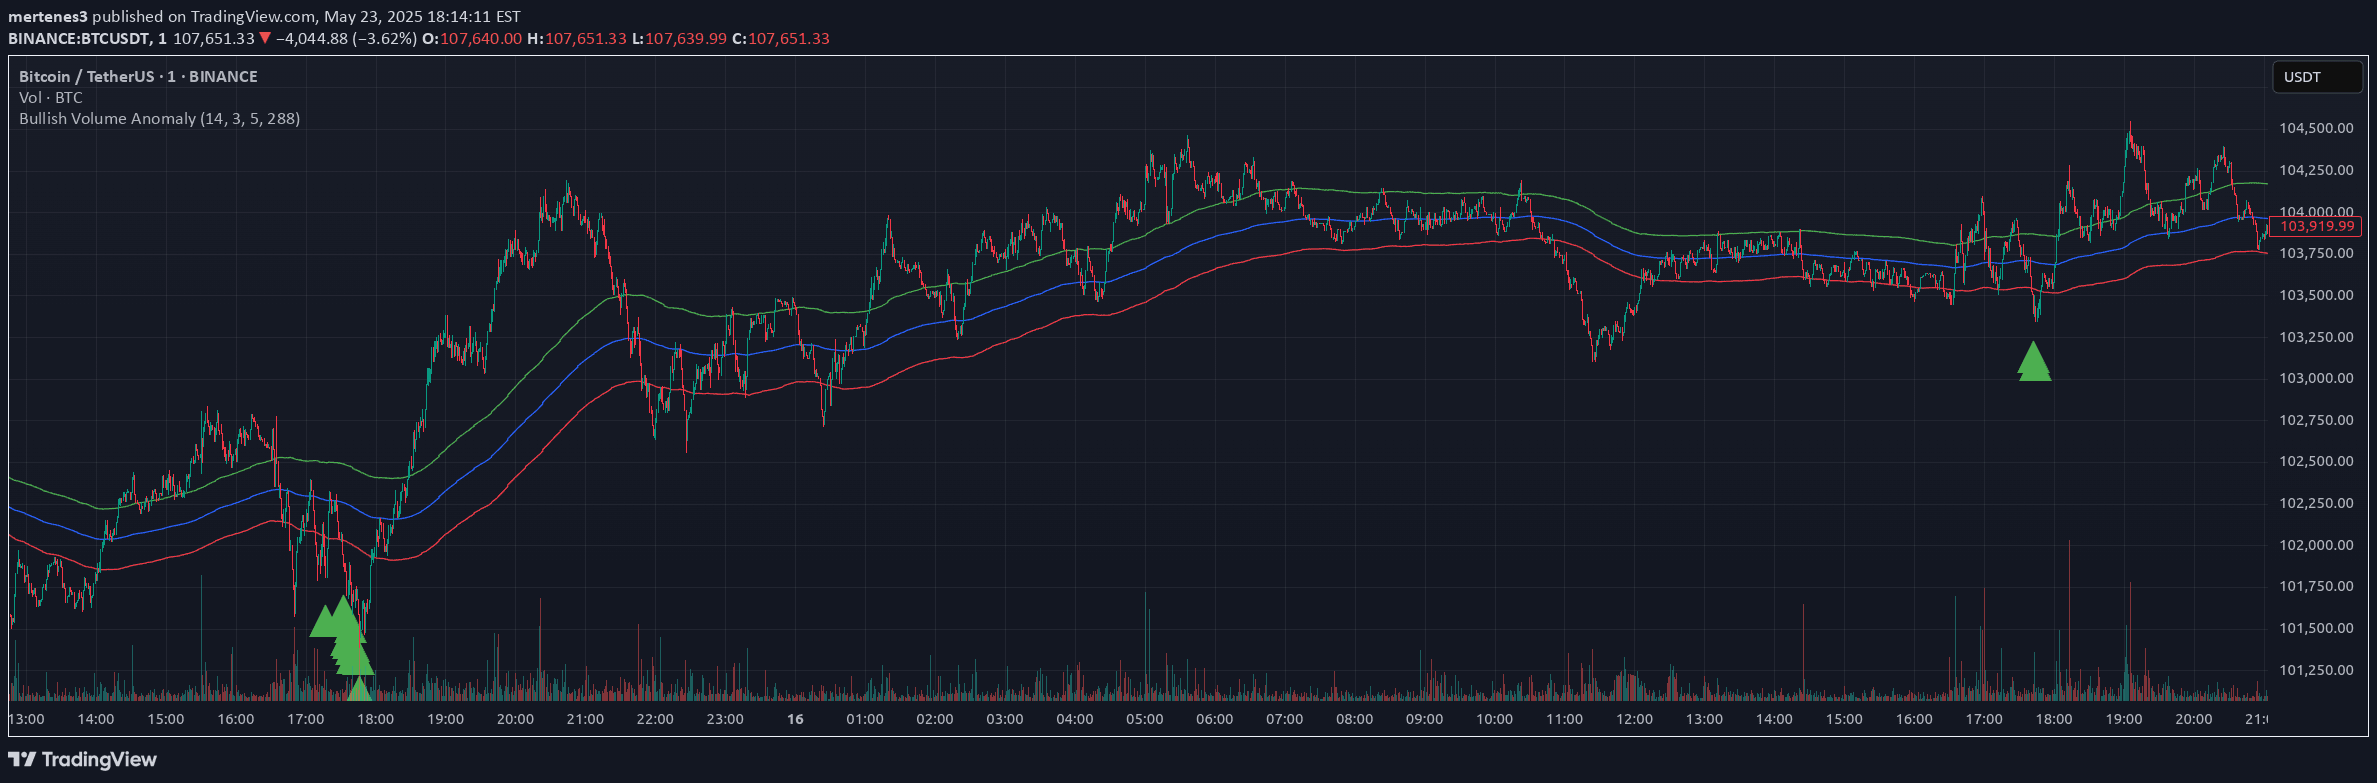
A custom trading signal that calculates unique numerical indicators for bullish and bearish bars, providing insights into price movements and potential trading opportunities.
Explore complementary indicator rolesHow it works
The signal performs separate calculations for bullish and bearish price bars by analyzing their price components. For bullish bars, it computes the absolute differences between open and low prices, and high and close prices, then normalizes these differences to create a percentage-based result.
For bearish bars, the process is similar but focuses on close and low prices, and high and open prices. The calculations compare these price differences and generate a normalized value that can indicate the strength and character of price movements across different market conditions.
Why it may be useful
This signal provides traders with a nuanced method of interpreting price bar dynamics beyond traditional technical analysis techniques. By breaking down price bar components and generating normalized values, traders can gain deeper insights into potential market sentiment and price momentum.
The approach offers a quantitative perspective on price action, allowing traders to assess subtle variations in bar movements that might not be immediately apparent through visual inspection. This can help in identifying potential entry and exit points with greater precision.
When to explore it
The signal is most effective in markets with clear directional movements and distinct price bar patterns. It works particularly well in short-term trading scenarios where rapid price changes and bar-to-bar variations are critical for decision-making.
Traders should consider using this signal in volatile markets where traditional indicators might provide less reliable signals. It is especially useful for scalping and day trading strategies that require quick, data-driven decisions based on granular price action analysis.
Keep exploring
What we’ve verified
Access, alerts and repainting behaviour have not been independently verified for this indicator. Check the creator’s current publication and settings.
General descriptions and classifications are recovered research. Verified details above identify the specific checks we have completed. Check the creator’s current publication for later changes.