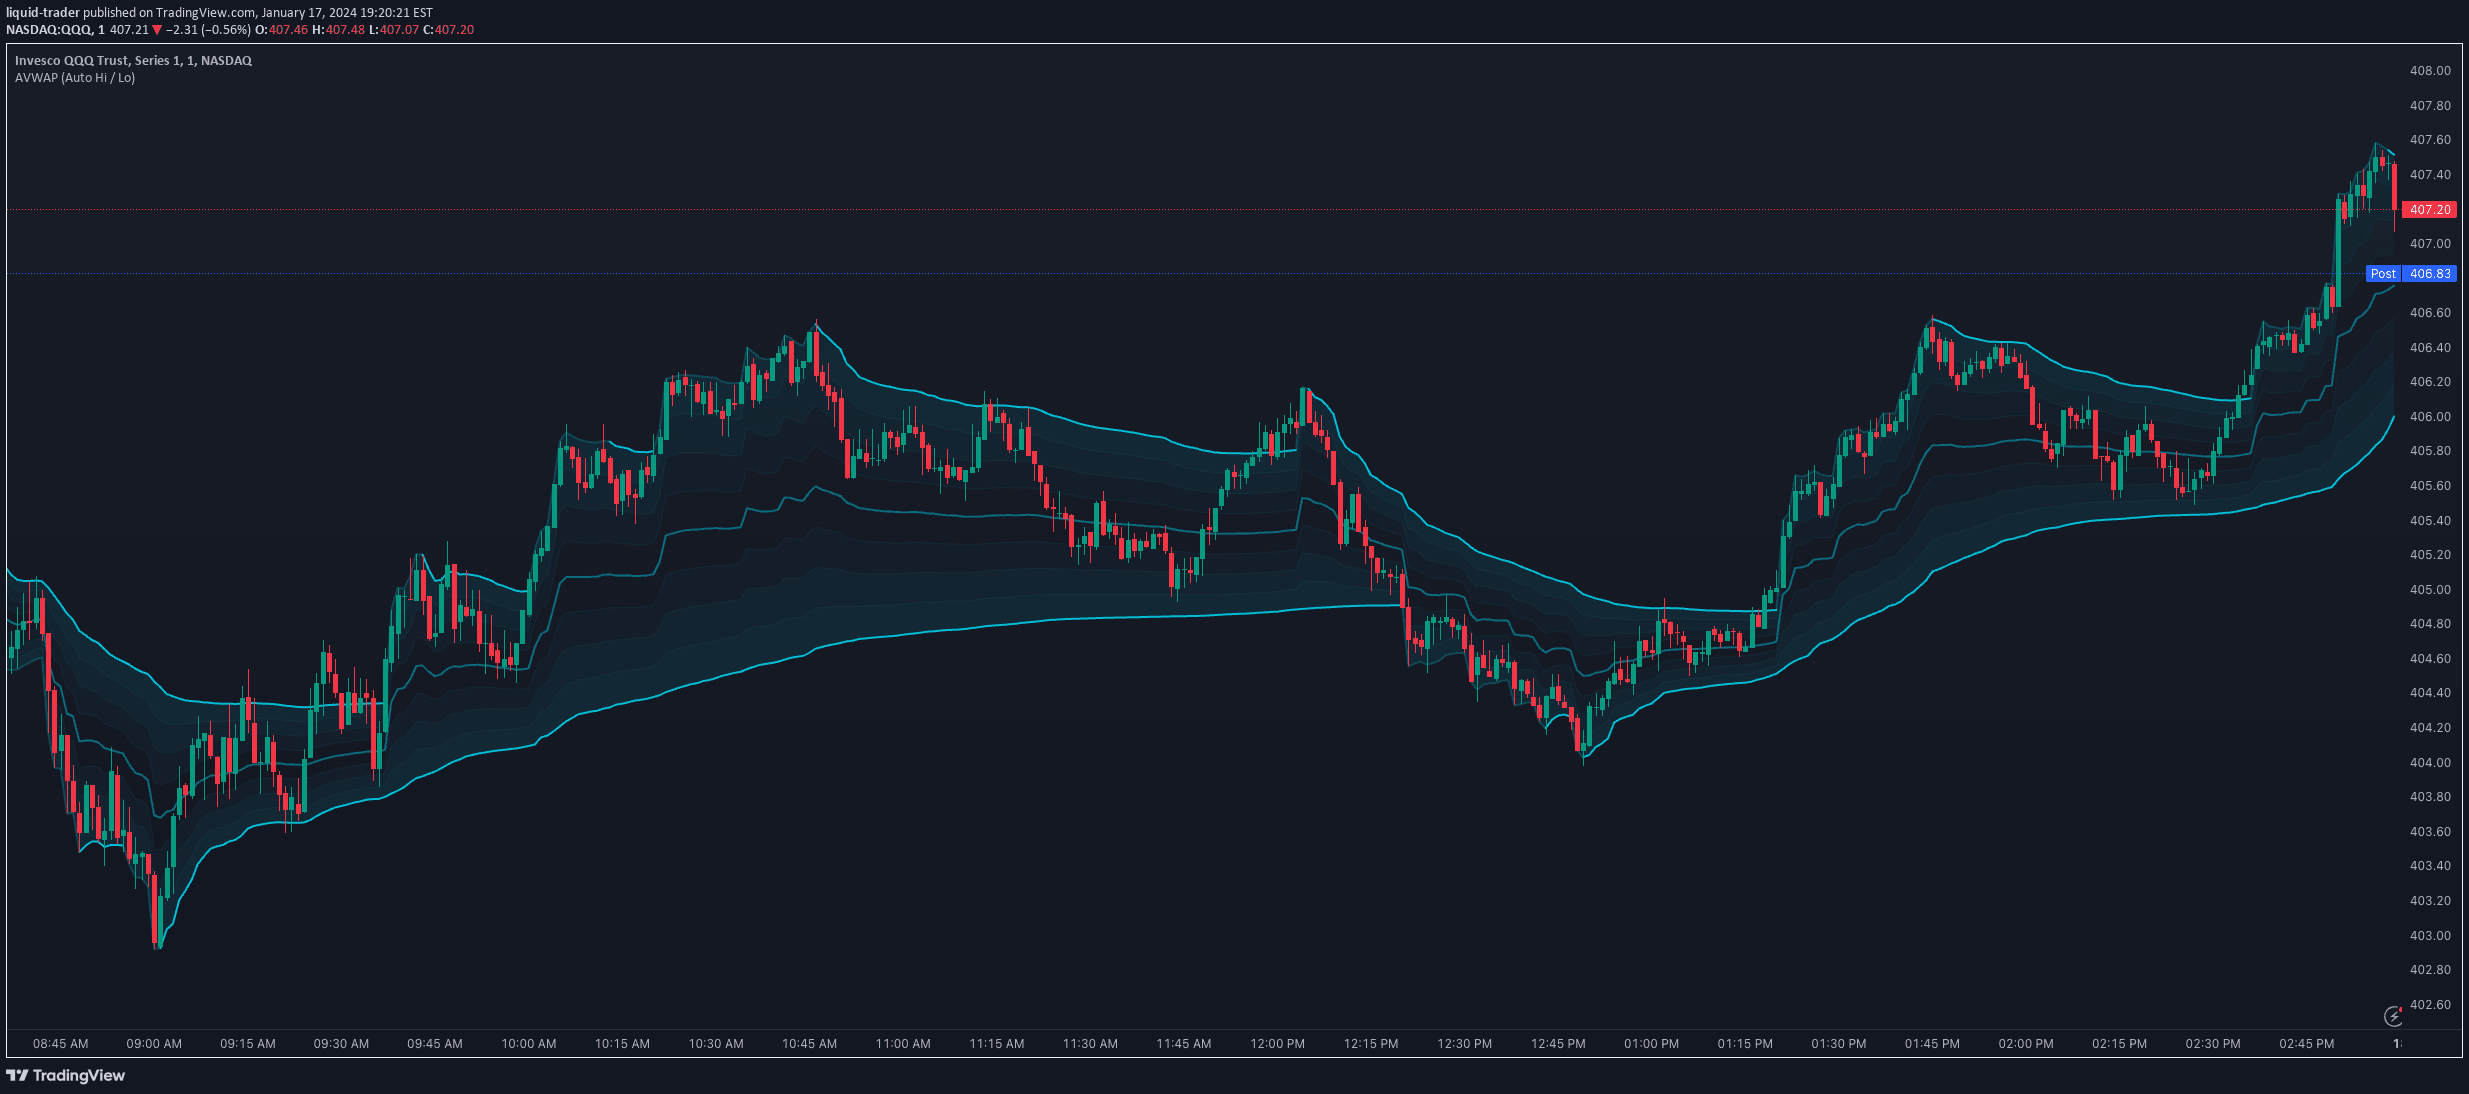
A comprehensive price action indicator that displays monthly, weekly, and daily price levels, offering logarithmic price lines and optional moving averages for enhanced trading insights.
Explore complementary indicator rolesHow it works
The Ultimate Price Action Indicator provides dynamic price levels by calculating the high, midpoint, and low for monthly, weekly, and daily timeframes. It plots these levels directly on the price chart, allowing traders to quickly visualize key price reference points that can act as potential support and resistance zones.
Additionally, the indicator offers optional features like logarithmic price line plotting and customizable moving averages. Traders can choose between simple, exponential, or weighted moving average types, which can be overlaid on the price chart to provide additional trend and momentum insights.
Why it may be useful
This indicator simplifies complex price analysis by presenting multiple timeframe levels in a clear, visual format. By displaying historical highs, midpoints, and lows across different periods, traders can quickly identify potential trend reversal or continuation zones without manual calculations.
The customizable features like logarithmic price lines and dual moving averages enhance trading decisions by providing flexible analytical tools. Traders can adapt the indicator to their specific strategy, making it a versatile tool for understanding market structure and potential price movement dynamics.
When to explore it
The Ultimate Price Action Indicator is most effective in markets with clear trend structures and predictable price movements. It works exceptionally well in forex, stock, and cryptocurrency markets where historical price levels play a significant role in future price action.
Traders should utilize this indicator during periods of market consolidation, trend identification, and when seeking precise entry and exit points. It is particularly useful for identifying potential support and resistance levels, understanding market structure, and confirming trend strength across multiple timeframes.
Keep exploring
What we’ve verified
Access, alerts and repainting behaviour have not been independently verified for this indicator. Check the creator’s current publication and settings.
General descriptions and classifications are recovered research. Verified details above identify the specific checks we have completed. Check the creator’s current publication for later changes.