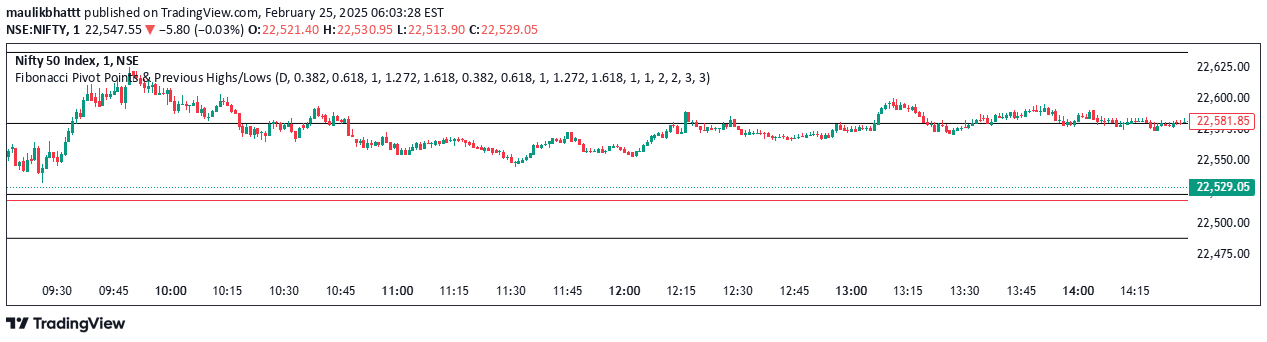
A custom chart indicator that plots high and low points for multiple trading sessions, allowing traders to visualize key price levels across different timeframes with customizable visual settings.
Explore complementary indicator rolesHow it works
This indicator dynamically plots the high and low points for different trading sessions including regular trading hours (RTH), overnight/extended hours, and intraday breakout levels. It automatically tracks and displays price extremes for previous day, week, month, and year periods, providing a comprehensive visual representation of key price levels.
Users can customize the indicator's appearance by enabling or disabling specific plots, adjusting line lengths, offsets, and colors. The flexible configuration allows traders to tailor the visual presentation to their individual preferences and trading style, making it adaptable to various analytical approaches.
Why it may be useful
By consolidating multiple timeframe price levels into a single visual display, this indicator helps traders quickly identify critical support and resistance zones across different market contexts. It provides a holistic view of price dynamics, enabling more informed decision-making and strategic trade planning.
The customization options allow traders to personalize their chart analysis, making complex price information more accessible and easier to interpret. This versatility makes the indicator valuable for traders seeking a comprehensive yet adaptable tool for understanding market structure and potential trading opportunities.
When to explore it
This indicator is most effective during periods of market volatility when understanding multiple timeframe price levels can provide strategic insights. It is particularly useful for traders looking to identify key support and resistance zones, potential breakout points, and overall market structure across different trading sessions.
Traders can leverage this tool in both trending and ranging markets, using the customizable visual elements to highlight important price levels that might inform entry, exit, and risk management decisions. Its flexibility makes it suitable for various trading styles and timeframes, from scalping to swing trading.
Keep exploring
What we’ve verified
Access, alerts and repainting behaviour have not been independently verified for this indicator. Check the creator’s current publication and settings.
General descriptions and classifications are recovered research. Verified details above identify the specific checks we have completed. Check the creator’s current publication for later changes.