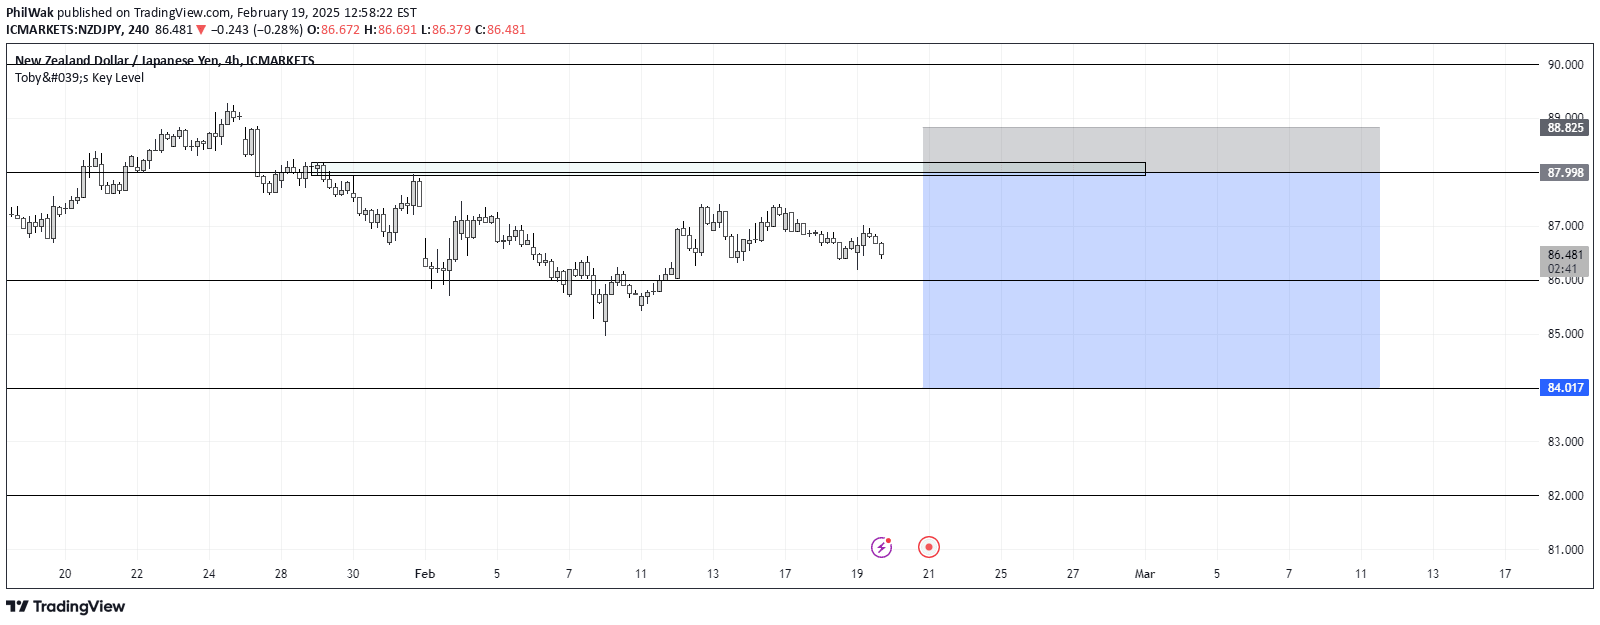
A comprehensive time-based price level indicator that highlights key market levels across multiple timeframes, helping traders identify potential support, resistance, and market direction.
Explore complementary indicator rolesHow it works
The indicator generates a detailed table tracking price levels across multiple timeframes, including previous month, week, and day high, low, open, close, and mean thresholds. It calculates specific price points using mathematical algorithms that determine midpoints and equilibrium levels.
The table is dynamically sorted in descending price order and color-coded to show the relationship between current price and historical levels. Lines can be plotted on the chart to visually represent these key price levels, allowing traders to quickly understand market structure and potential price interactions.
Why it may be useful
This indicator provides traders with a comprehensive view of market structure by consolidating multiple time-based price levels into a single, easy-to-read format. By highlighting previous highs, lows, opens, and closes, it helps traders understand potential support and resistance zones that might influence future price movement.
The color-coded presentation and optional chart lines make it easier for traders to quickly assess market dynamics, identify potential entry and exit points, and develop a more nuanced understanding of price behavior across different timeframes.
When to explore it
Traders can utilize this indicator most effectively during periods of range-bound or trending markets where historical price levels play a significant role in determining future price action. It is particularly useful for identifying potential bounce or rejection zones based on previous market structure.
The indicator is most powerful when combined with other technical analysis tools, helping traders develop a more comprehensive market narrative and making more informed trading decisions across various timeframes and trading styles.
Keep exploring
What we’ve verified
Access, alerts and repainting behaviour have not been independently verified for this indicator. Check the creator’s current publication and settings.
General descriptions and classifications are recovered research. Verified details above identify the specific checks we have completed. Check the creator’s current publication for later changes.