An advanced trend-following indicator combining Hull Moving Average with Adaptive RSI to track price movements and assess momentum strength with reduced market noise.
Explore complementary indicator rolesHow it works
The Hull Moving Average Adaptive RSI integrates two powerful analytical techniques. First, it calculates the Hull Moving Average using weighted moving average calculations that emphasize recent price movements while smoothing out market fluctuations.
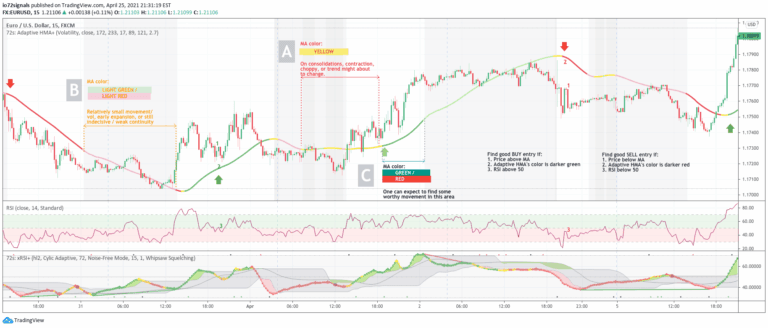
Then, it overlays an Adaptive RSI that dynamically adjusts its sensitivity based on market volatility. The indicator uses color coding to represent different momentum states: red for potential overbought conditions, gray for market balance, and blue for potential oversold scenarios
Why it may be useful
This indicator provides traders with a comprehensive view of market trends and momentum dynamics. By combining trend tracking with momentum analysis, it offers more nuanced insights than traditional moving averages.
The Hull Moving Average reduces lag and noise, while the Adaptive RSI adds depth by revealing potential trend exhaustion or continuation. Traders can quickly interpret market conditions through intuitive color signals, making complex market analysis more accessible and actionable
When to explore it
The Hull Moving Average Adaptive RSI is most effective on timeframes from 1-hour to daily charts. It excels in trading indices, stocks, forex, and cryptocurrencies where momentum shifts are frequent.
Traders should use this indicator when seeking to identify trend direction, assess momentum strength, and spot potential trend reversals. It is particularly useful during market transitions, helping traders distinguish between genuine trend changes and temporary price fluctuations
Keep exploring
What we’ve verified
Access, alerts and repainting behaviour have not been independently verified for this indicator. Check the creator’s current publication and settings.
General descriptions and classifications are recovered research. Verified details above identify the specific checks we have completed. Check the creator’s current publication for later changes.