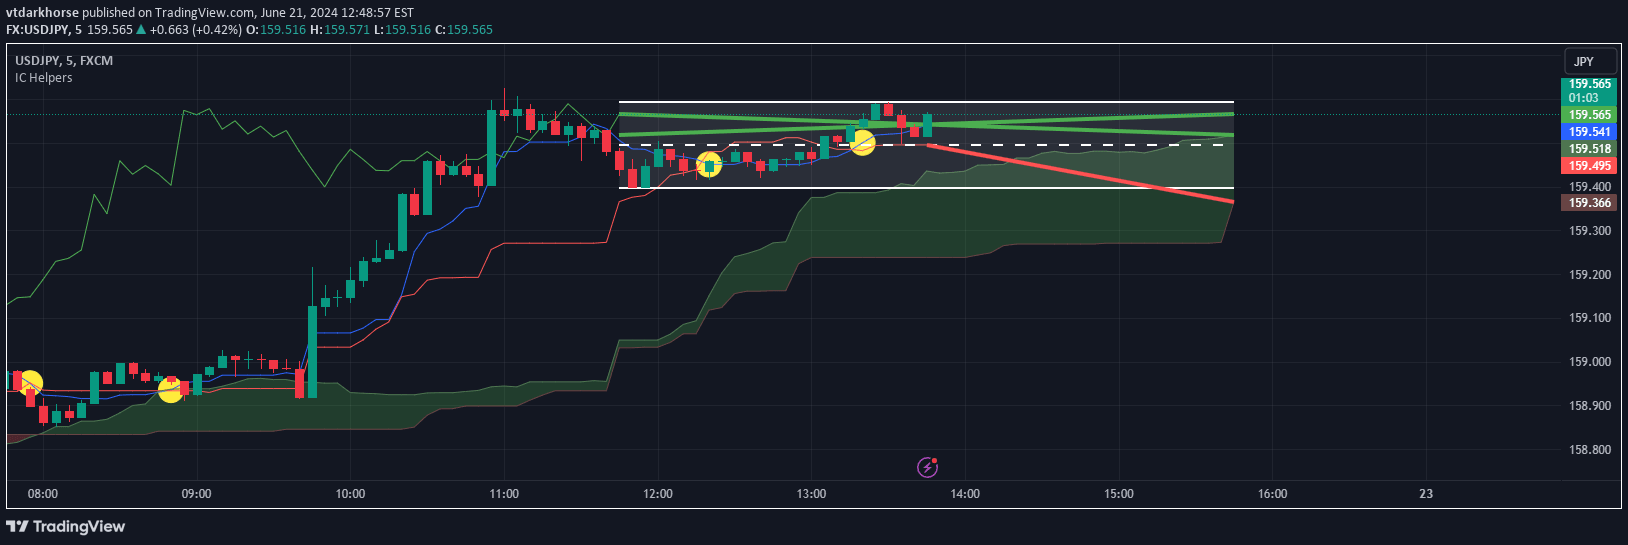
An Ichimoku-based indicator that creates visual boxes to highlight key price periods, offering customizable periods and shifts for detailed market structure analysis.
Explore complementary indicator rolesHow it works
The Ichimoku Box Indicator transforms traditional Ichimoku analysis by creating visual boxes representing key trading periods. Users can customize box periods with default settings of 9, 26, and 52, allowing flexible visualization of market structure. The indicator automatically generates vertical lines and boxes when applied to a chart, with the ability to drag and reposition these elements for precise analysis.
Each box includes high and low markers that identify the extreme price points within that period. A unique candle countdown timer shows the remaining candles before a box loses its high or low reference point, providing traders with real-time structural insights.
Why it may be useful
The Ichimoku Box Indicator simplifies complex market analysis by converting abstract Ichimoku concepts into easily digestible visual representations. By transforming numerical periods into graphical boxes, traders can more intuitively understand market dynamics and potential trend shifts. The customizable nature of the indicator allows for personalized analysis across different trading styles and timeframes.
Visual cues like high and low markers help traders quickly identify critical price levels and potential turning points. The drag-and-drop functionality and candle countdown timer provide additional layers of interactive analysis, making complex technical information more accessible and actionable for traders of all experience levels.
When to explore it
The Ichimoku Box Indicator is most effective in markets with clear trending characteristics, such as forex, stocks, and cryptocurrency markets. It works best when traders want to analyze multiple timeframes simultaneously and identify potential trend transitions. The indicator is particularly useful during periods of market consolidation or when seeking to understand underlying market structure.
Traders can leverage this tool across various trading styles, from short-term scalping to longer-term swing trading. Its flexibility allows adaptation to different market conditions, making it valuable for identifying potential entry and exit points. The visual representation helps traders quickly assess market momentum and potential future price movements.
Keep exploring
What we’ve verified
Access, alerts and repainting behaviour have not been independently verified for this indicator. Check the creator’s current publication and settings.
General descriptions and classifications are recovered research. Verified details above identify the specific checks we have completed. Check the creator’s current publication for later changes.