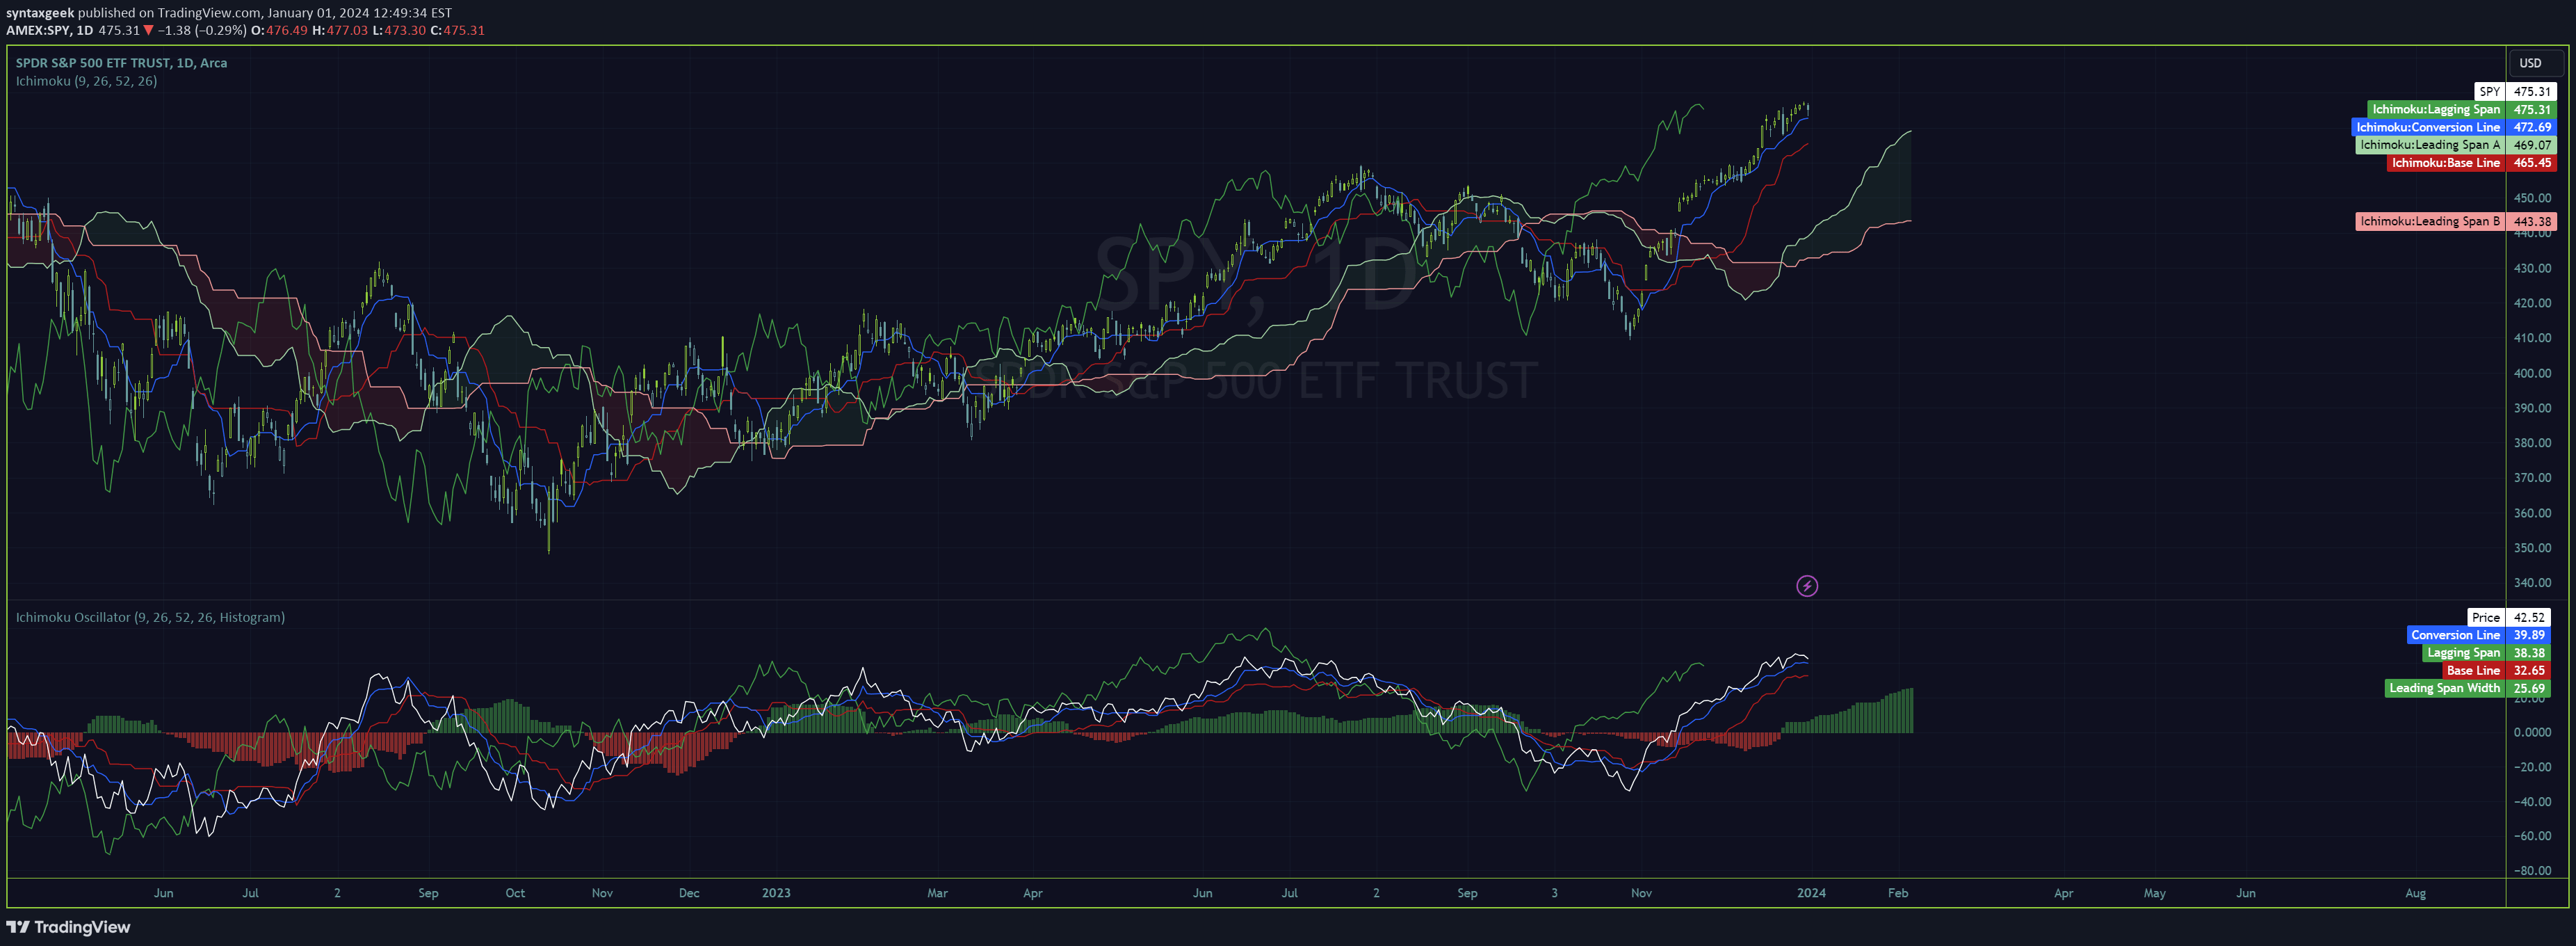
An advanced wave oscillator using custom moving averages to analyze market trends across short, medium, and long-term timeframes with crossover signals.
Explore complementary indicator rolesHow it works
The Ichimoku Wave Oscillator calculates three distinct waves using different moving average types: Wave 9-17 for short-term trends, Wave 17-26 for medium-term trends, and Wave 9-26 for long-term trends. Each wave represents the difference between moving averages of specific periods, allowing traders to visualize trend dynamics.
The indicator combines TEMA (Triple Exponential Moving Average) and SMMA (Smoothed Moving Average) to capture both short-term sensitivity and long-term stability. Traders can select from various moving average types like SMA, EMA, WMA, TEMA, and SMMA, providing flexibility in trend analysis and signal generation.
Why it may be useful
This oscillator offers a sophisticated approach to trend analysis by simultaneously examining multiple timeframes, enabling traders to make more informed decisions. By visualizing waves around a zero line, it provides clear insights into market direction, with waves above zero indicating uptrends and below zero signaling downtrends.
The unique combination of TEMA and SMMA makes this indicator particularly valuable, as it balances the quick responsiveness of short-term moving averages with the stability of long-term trends. This dual approach helps traders identify potential trend reversals and crossover points more effectively than traditional single moving average methods.
When to explore it
The Ichimoku Wave Oscillator is most effective in markets with clear trending characteristics, where price movements show consistent directional momentum. It performs exceptionally well in forex, stocks, and cryptocurrency markets that experience regular wave-like price fluctuations.
Traders can leverage this indicator across different timeframes, from scalping to swing trading. For short-term strategies, focus on Wave 9-17 for quick trend changes, while medium-term traders can analyze Wave 17-26. Long-term investors can use Wave 9-26 to understand broader market trends and potential major trend shifts.
Keep exploring
What we’ve verified
Access, alerts and repainting behaviour have not been independently verified for this indicator. Check the creator’s current publication and settings.
General descriptions and classifications are recovered research. Verified details above identify the specific checks we have completed. Check the creator’s current publication for later changes.