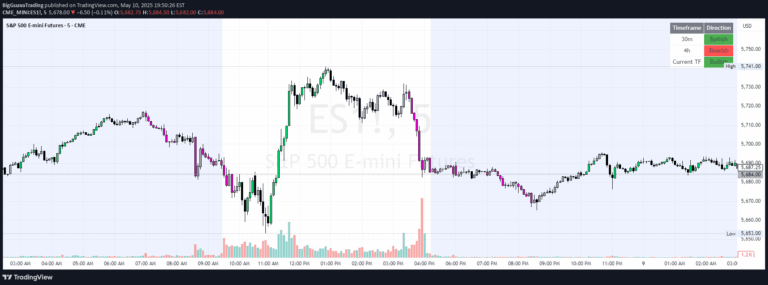
An advanced trading indicator visualizing key market sessions, timing windows, and price levels using the Inner Circle Trader methodology for precise market analysis.
Explore complementary indicator rolesHow it works
The ICT Killzones indicator operates by mapping out critical trading sessions including Asia, London, and New York market periods with distinct visual markers. It plots key price levels such as session highs and lows, creating reference points for traders to understand market structure and potential turning points.
The indicator highlights specific macro timing windows like the First Macro (9:45-10:15 AM EST) and Second Macro (10:45-11:15 AM EST) using L-shaped brackets. These precise time intervals help traders identify potential market entry and exit points based on historical market behavior and ICT trading methodology.
Why it may be useful
The ICT Killzones indicator provides traders with a comprehensive visual framework for understanding complex market dynamics across different global trading sessions. By offering clear markers and reference levels, it helps traders make more informed decisions by revealing underlying market structure and potential turning points.
Traders gain a strategic advantage through enhanced market timing insights, allowing them to anticipate potential price movements and identify high-probability trading opportunities. The indicator's customizable features and clean design make it a powerful tool for traders seeking to implement advanced market analysis techniques.
When to explore it
The ICT Killzones indicator is most effective during active market hours, particularly during major trading sessions like London and New York. Traders can utilize this tool when seeking to understand market transitions, identify potential entry and exit points, and analyze session-specific price dynamics.
It is particularly valuable for traders focusing on intraday and short-term trading strategies, providing critical insights into market structure and timing. The indicator works best when combined with other technical analysis tools and a solid understanding of market mechanics.
Keep exploring
What we’ve verified
Access, alerts and repainting behaviour have not been independently verified for this indicator. Check the creator’s current publication and settings.
General descriptions and classifications are recovered research. Verified details above identify the specific checks we have completed. Check the creator’s current publication for later changes.