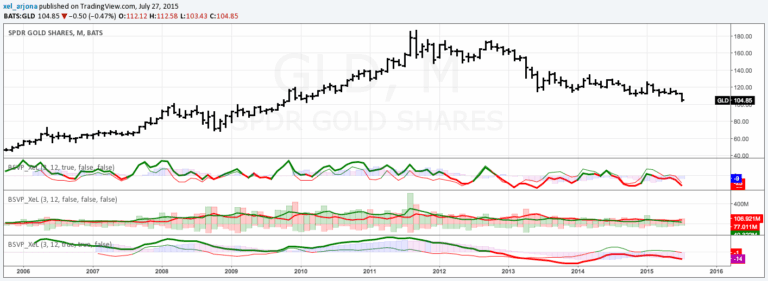
An intraday volume pressure indicator that reveals bullish and bearish trading volume differences, helping traders understand potential market momentum and volume-driven price movements.
Explore complementary indicator rolesHow it works
The indicator calculates volume pressure by analyzing intraday minute bars, typically using 15-minute intervals. It adds volume from up-candles and subtracts volume from down-candles to create an intraday summary volume. The indicator then plots green bars for days with higher closes and red bars for days with lower closes, reflecting the volume pressure direction.
A floating sum average is calculated over a default 5-day period, which provides a smoothed view of volume pressure. The oscillator displays the volume pressure trend, showing whether buying or selling volume is dominating during specific trading periods.
Why it may be useful
This volume pressure indicator helps traders understand underlying market dynamics beyond simple price movement. By revealing the strength and direction of trading volume, it provides insights into potential market manipulation, hidden momentum, and divergences between price action and volume.
Traders can use this indicator to identify potential trend reversals, confirm existing market movements, and gain a deeper understanding of market sentiment. It offers a unique perspective on market behavior by highlighting volume-driven pressures that might not be immediately apparent from price charts alone.
When to explore it
The indicator works best in sideways or slow-moving markets where volume differences can provide meaningful insights. It is particularly useful for analyzing markets with consistent trading patterns, such as futures contracts like 6E, where intraday volume variations can reveal underlying market dynamics.
Traders should apply this indicator in daily charts, avoiding intraday or weekly timeframes. It is most effective when used alongside other analytical tools and fundamental market analysis, helping to provide a more comprehensive view of potential market movements.
Keep exploring
What we’ve verified
Access, alerts and repainting behaviour have not been independently verified for this indicator. Check the creator’s current publication and settings.
General descriptions and classifications are recovered research. Verified details above identify the specific checks we have completed. Check the creator’s current publication for later changes.