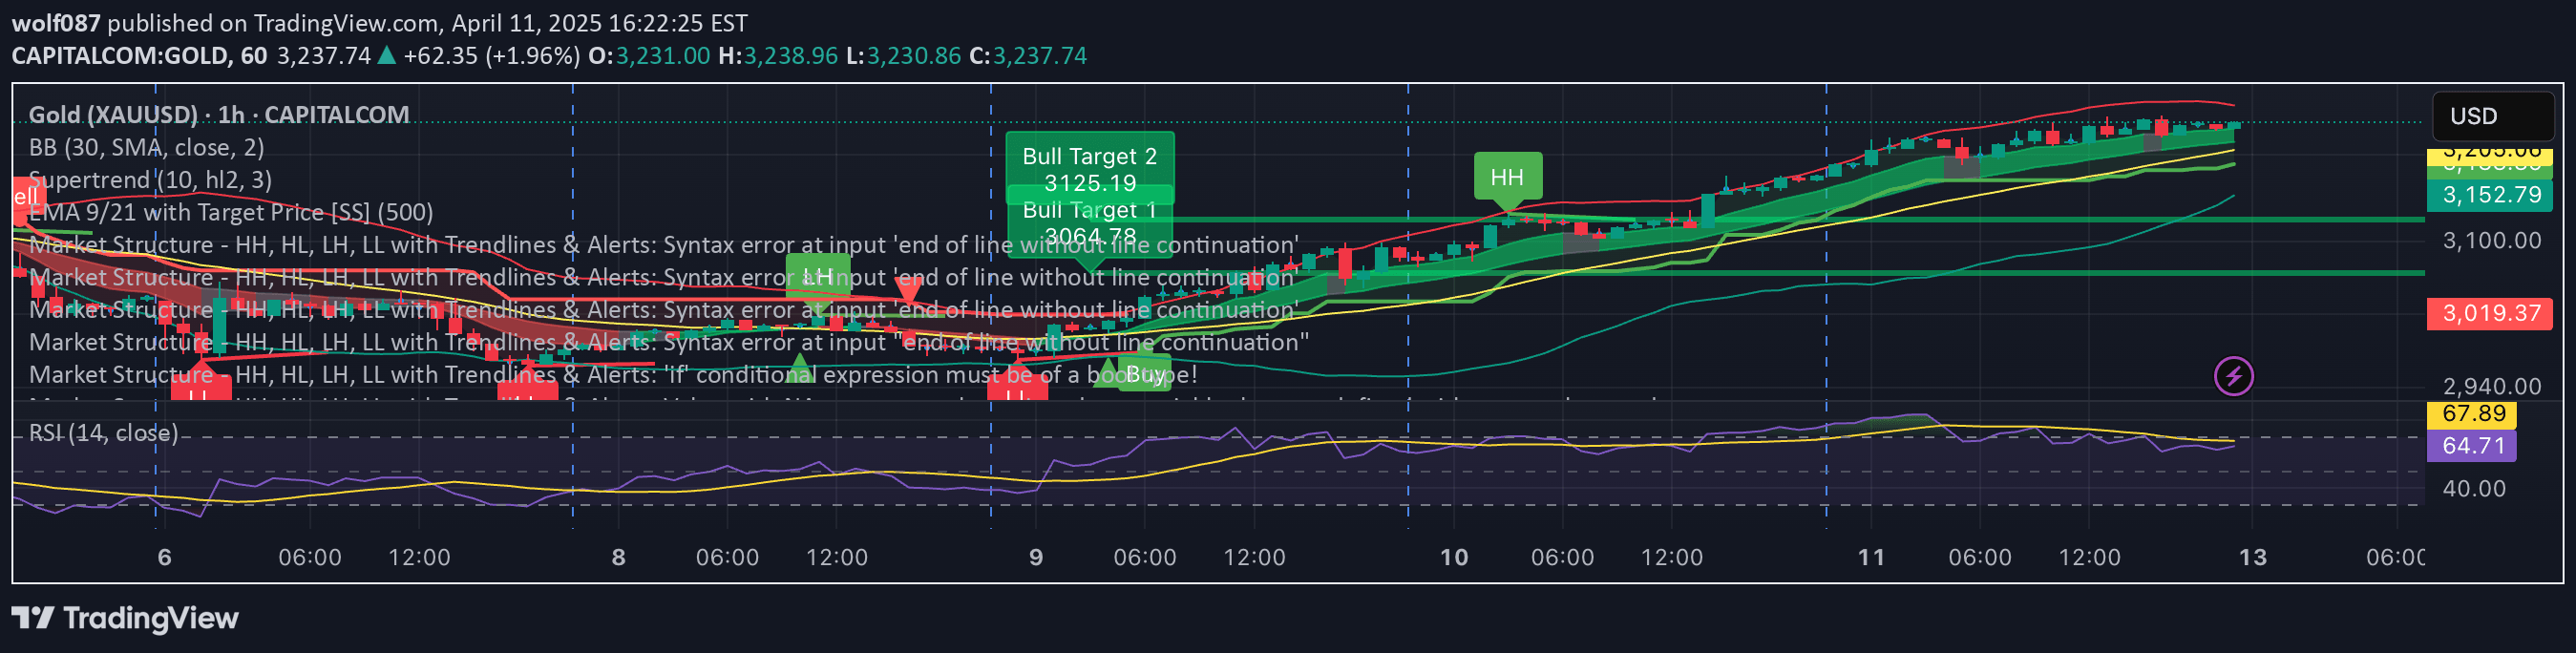
A dual exponential moving average indicator combining short-term and long-term trend analysis to identify potential market momentum shifts and trend directions.
Explore complementary indicator rolesHow it works
The Double EMA is calculated by applying the exponential moving average formula twice to a price series, creating a smoother and more responsive trend line. By computing the first EMA and then applying a second EMA to that result, the indicator generates a more dynamic representation of price momentum that reacts quickly to recent market changes.
The 200 EMA complements this by providing a long-term trend perspective, calculated using closing prices over 200 periods. When combined, these moving averages create a comprehensive view of both short-term and long-term price movements, allowing traders to identify potential trend shifts and trading opportunities.
Why it may be useful
The Double EMA and 200 EMA indicator provides traders with a nuanced understanding of market dynamics by revealing both immediate price momentum and broader trend direction. This dual perspective helps traders make more informed decisions by offering insights into potential trend reversals and market sentiment.
By integrating short-term and long-term analysis, the indicator reduces the noise of price fluctuations and helps traders distinguish between temporary market movements and more significant trend changes. This approach allows for more strategic entry and exit points, potentially improving trading accuracy and risk management.
When to explore it
The Double EMA and 200 EMA indicator is most effective in markets with clear trending characteristics, such as stocks, forex, and cryptocurrencies. Traders can utilize this tool during periods of sustained market movement, where short-term and long-term trends align, providing more reliable signals for potential trades.
It is particularly valuable during market transitions, helping traders identify potential trend reversals or continuations. The indicator works best when complemented with other technical analysis tools and fundamental market research, offering a comprehensive approach to understanding market dynamics and potential trading opportunities.
Keep exploring
What we’ve verified
Access, alerts and repainting behaviour have not been independently verified for this indicator. Check the creator’s current publication and settings.
General descriptions and classifications are recovered research. Verified details above identify the specific checks we have completed. Check the creator’s current publication for later changes.