A comprehensive trading suite that provides multi-layered market analysis using moving averages, price tightening indicators, and sector/market dashboards for trend identification.
Explore complementary indicator rolesHow it works
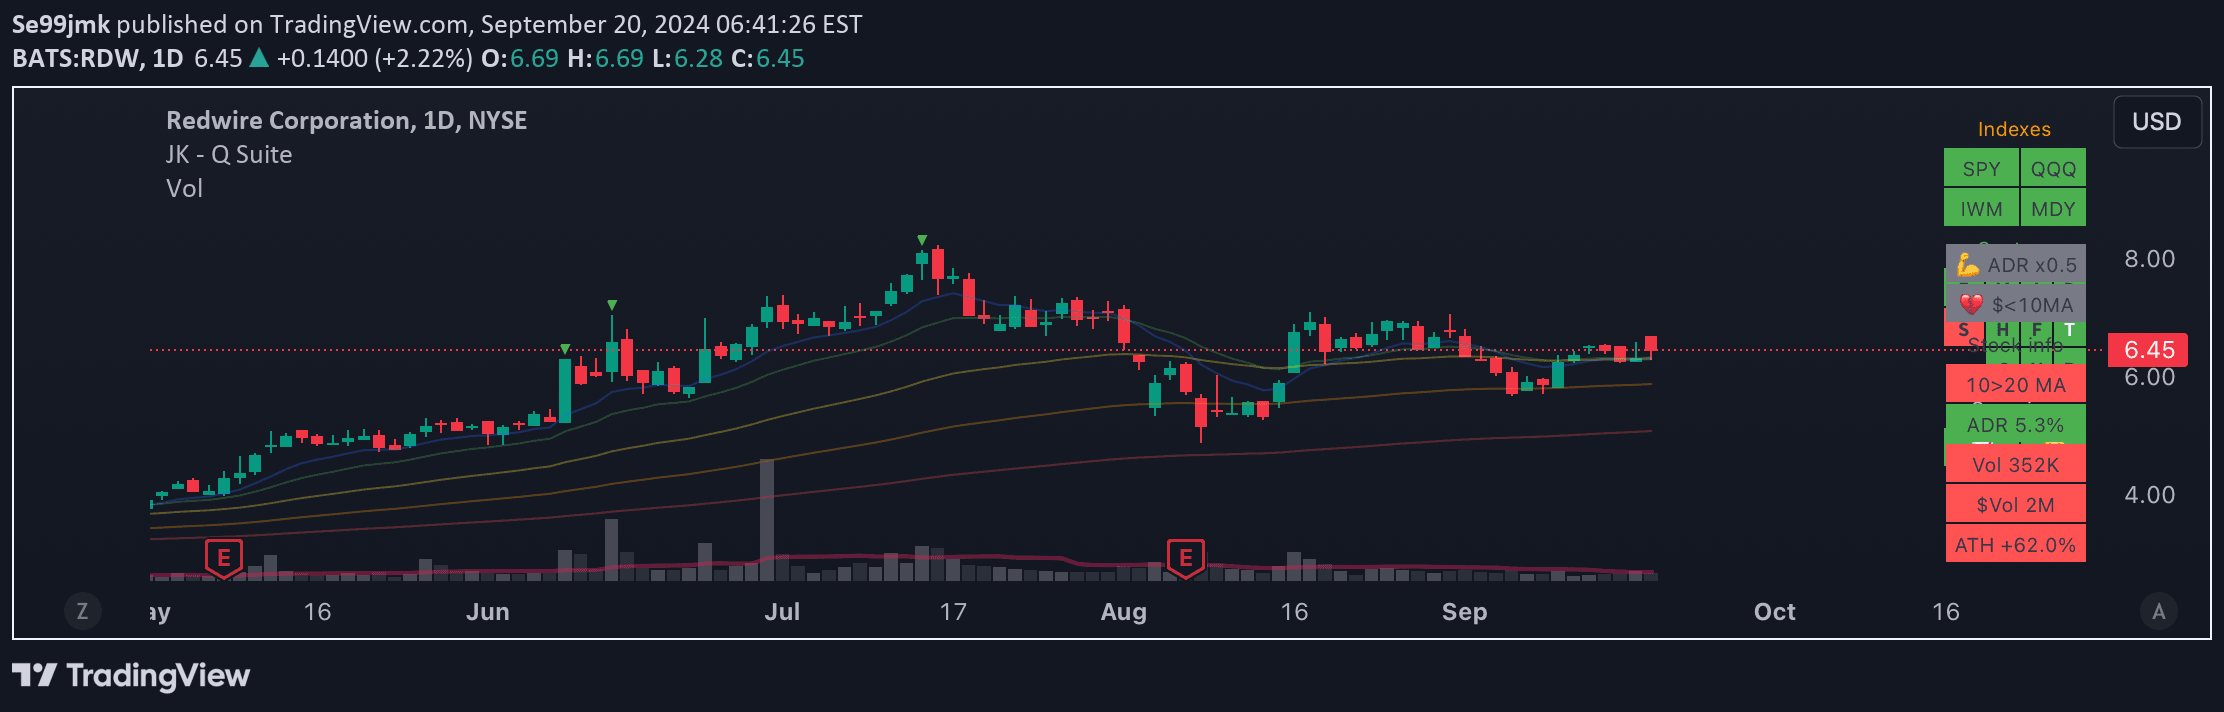
The indicator creates a multi-dimensional analysis framework by integrating several technical tools like moving averages across different timeframes. It tracks price behavior through colored bar indicators showing price tightening, with blue and orange bars representing different levels of price compression relative to average daily range.
Additionally, the system includes market and sector dashboards that use moving average crossovers and price relationships to provide quick visual insights into broader market conditions. The strength and weakness cells offer traders quick assessments of potential stock movements by measuring price extension above key moving averages.
Why it may be useful
This trading suite provides traders with a comprehensive, at-a-glance view of market conditions, reducing the complexity of multiple indicator analysis. By consolidating various technical signals into one cohesive system, traders can quickly assess potential trading opportunities across different timeframes and market contexts.
The integrated approach allows for rapid decision-making by presenting multiple layers of market information simultaneously. Traders can quickly understand stock strength, sector performance, and potential trend changes without manually analyzing numerous separate indicators.
When to explore it
The indicator is most effective during trending market conditions, particularly in Stage 2 uptrends where clear momentum and directional movement are present. It works best for traders seeking a holistic view of market dynamics, combining multiple technical analysis tools into a single, easy-to-read interface.
Traders can leverage this tool most effectively when looking to identify potential entry and exit points in stocks showing consistent price movement. The multi-layered approach is particularly useful for day and swing traders who need quick, actionable insights into market behavior and individual stock performance.
Keep exploring
What we’ve verified
Access, alerts and repainting behaviour have not been independently verified for this indicator. Check the creator’s current publication and settings.
General descriptions and classifications are recovered research. Verified details above identify the specific checks we have completed. Check the creator’s current publication for later changes.