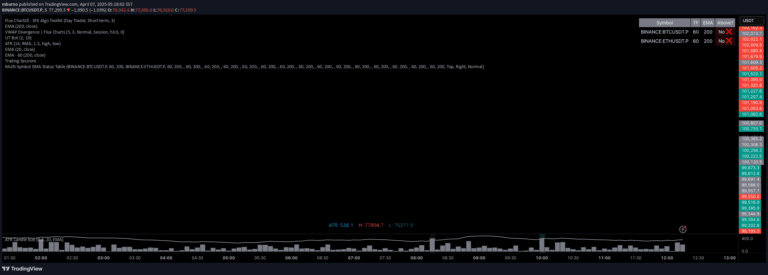
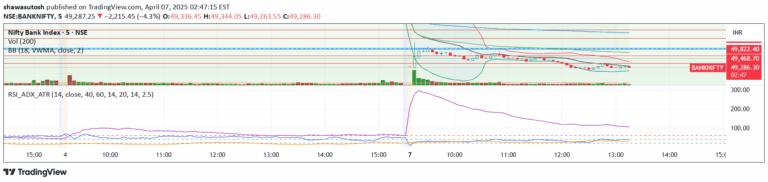
An advanced indicator that tracks price distances from multiple moving averages, revealing extreme market movements and providing insights into price dynamics across different timeframes.
Explore complementary indicator rolesHow it works
The Extremes Profiler operates by calculating the distance between current prices and various moving averages, including EMA, SMA, WMA, RMA, and HMA. It quantifies these distances and identifies the top 50 or 100 most significant deviations, effectively creating a comprehensive map of price extremities.
By tracking these distances across multiple moving average types and customizable periods, the indicator provides traders with a nuanced view of market behavior. Users can adjust the settings to align with their specific trading strategy, enabling a flexible and adaptive approach to analyzing price movements and potential market turning points.
Why it may be useful
The Extremes Profiler is crucial for traders seeking a deeper understanding of market dynamics beyond traditional price analysis. By highlighting significant price deviations from moving averages, it offers unique insights into market volatility, trend strength, and potential reversal points that might be overlooked by conventional indicators.
This tool's ability to compare assets and analyze price extremities across different timeframes makes it an invaluable resource for traders. It helps identify significant market movements, understand underlying trends, and make more informed trading decisions by providing a comprehensive and multi-dimensional view of price behavior.
When to explore it
The Extremes Profiler is most effective during periods of significant market volatility, where price movements deviate substantially from standard moving averages. Traders can utilize this indicator during trending markets, breakout scenarios, and when analyzing potential trend reversals across different financial instruments.
It is particularly useful when comparing multiple assets, seeking to understand relative market dynamics, or when developing a comprehensive trading strategy that requires in-depth price analysis. The indicator's flexibility in timeframe and moving average selection makes it adaptable to various trading styles and market conditions.
Keep exploring
What we’ve verified
Access, alerts and repainting behaviour have not been independently verified for this indicator. Check the creator’s current publication and settings.
General descriptions and classifications are recovered research. Verified details above identify the specific checks we have completed. Check the creator’s current publication for later changes.