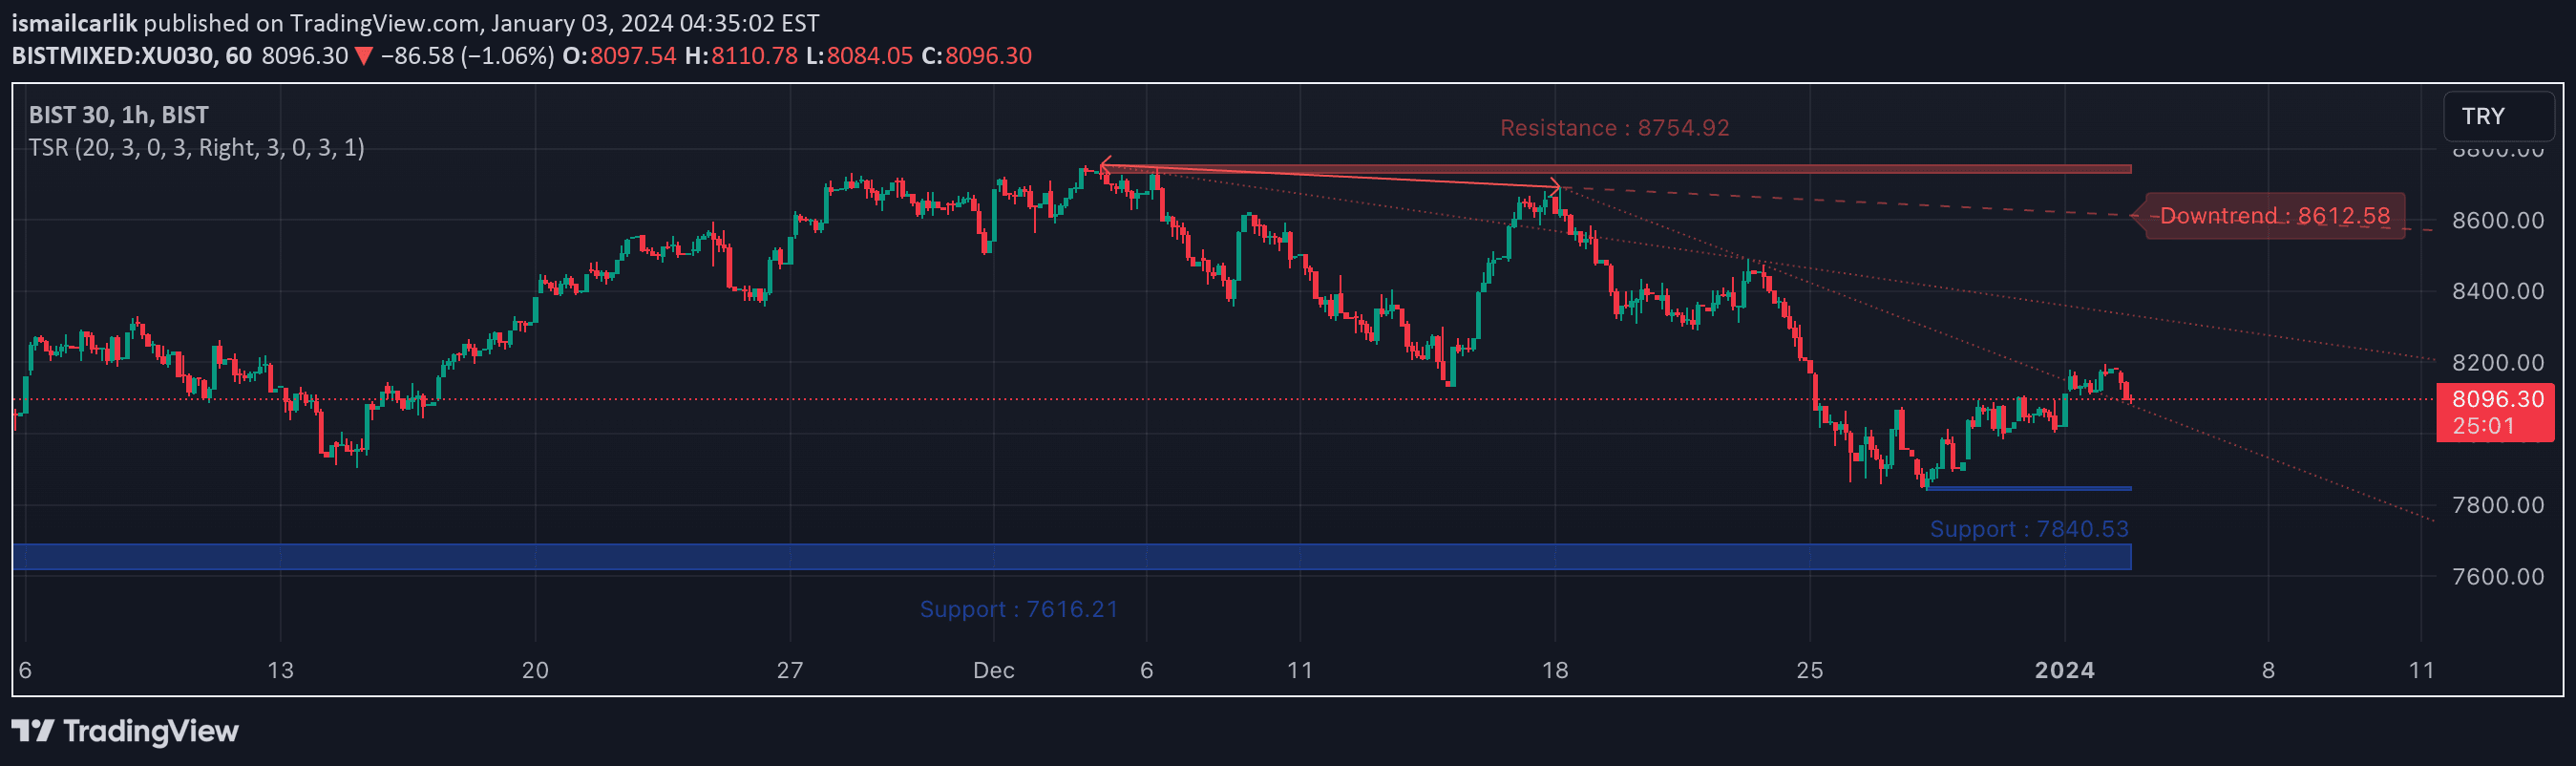
Linear regression lines help traders identify market trends by plotting a best-fit line through price data, revealing potential support and resistance levels for trading decisions.
Explore complementary indicator rolesHow it works
Linear regression lines are calculated by finding the best-fitting straight line through a series of price data points, minimizing the distance between the line and each data point. The line represents the overall trend direction, with an upward slope indicating a bullish trend and a downward slope suggesting a bearish trend.
The indicator plots three linear regression lines with customizable lengths and sources, allowing traders to analyze price movements from different perspectives. When price is above a line, it appears green and acts as potential support, while price below a line appears red and may serve as resistance.
Why it may be useful
Linear regression lines provide traders with a dynamic and adaptable tool for understanding market trends and potential price movements. By offering a mathematical representation of price direction, these lines help traders identify underlying market momentum and make more informed trading decisions.
The visual representation of trend direction allows traders to quickly assess market conditions, recognize potential support and resistance levels, and develop more strategic entry and exit points. This approach transforms complex price data into an easily interpretable format that can enhance trading precision and risk management.
When to explore it
Linear regression lines are most effective in markets with clear trending characteristics, where price movements show consistent directional momentum. They work particularly well in liquid markets with sufficient trading volume, such as major stock indices, futures contracts, and currency pairs.
Traders should use these lines in conjunction with other technical indicators to confirm signals and reduce false positives. They are especially useful during periods of sustained trends, when price consistently respects the linear regression lines as dynamic support or resistance levels.
Keep exploring
What we’ve verified
Access, alerts and repainting behaviour have not been independently verified for this indicator. Check the creator’s current publication and settings.
General descriptions and classifications are recovered research. Verified details above identify the specific checks we have completed. Check the creator’s current publication for later changes.