Linear Regression Oscillator [ChartPrime]
A custom indicator using linear regression to analyze closing prices, helping traders identify market trends, mean reversion, and potential overbought or oversold conditions across different timeframes.
Explore 11,183 indicators. Filter beyond the obvious.
Discover the tools that fit the way you trade.
11,183 tools to explore
A custom indicator using linear regression to analyze closing prices, helping traders identify market trends, mean reversion, and potential overbought or oversold conditions across different timeframes.
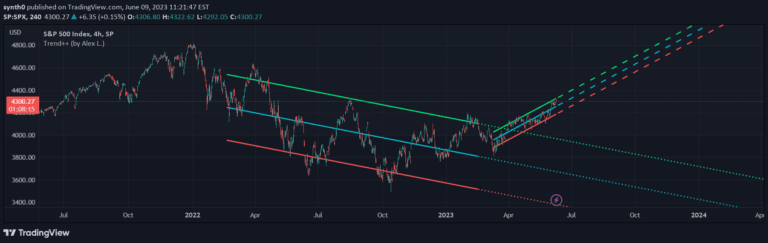
A comprehensive technical analysis tool that uses linear regression to plot channels, bands, and future price projections, helping traders identify trends, potential reversals, and market dynamics.
A trading calendar indicator that displays daily and monthly market sentiment using three different sentiment calculation methods to help traders quickly assess market direction.
A non-linear regression indicator analyzing multiple price variables to generate trading signals using machine learning techniques and gradient descent optimization.
A multi-anchored linear regression channel tool that uses advanced statistical techniques to analyze price trends, offering flexible regression and deviation calculations across multiple customizable channels.
A sophisticated trading indicator combining Heikin Ashi candles with Linear Regression to create a smoothed, trend-focused chart overlay that reduces market noise and highlights price momentum.
A trend channel indicator that identifies short-term and long-term market trends, allowing traders to pinpoint potential entry and exit points based on trend line positioning.
A TradingView script that uses linear regression and ATR to generate buy and sell signals across multiple symbols, providing technical analysis and market screening capabilities.
A novel moving average technique that reduces lag by projecting price movement using linear regression, helping traders identify trend shifts more responsively.
A predictive trading algorithm using linear regression and multiple technical indicators to forecast asset prices over the next 20 periods by analyzing market trends and volatility.
A comprehensive trend analyzer that combines multiple technical indicators to detect market trends, filter noise, and provide adaptive insights into price movement dynamics.
A LinReg Candles indicator that recalculates OHLC values using linear regression, creates a signal line, and generates trend-based buy/sell signals with customizable settings.
Likes, views, and comments are historical TradingView snapshots. They describe attention, not trading performance.