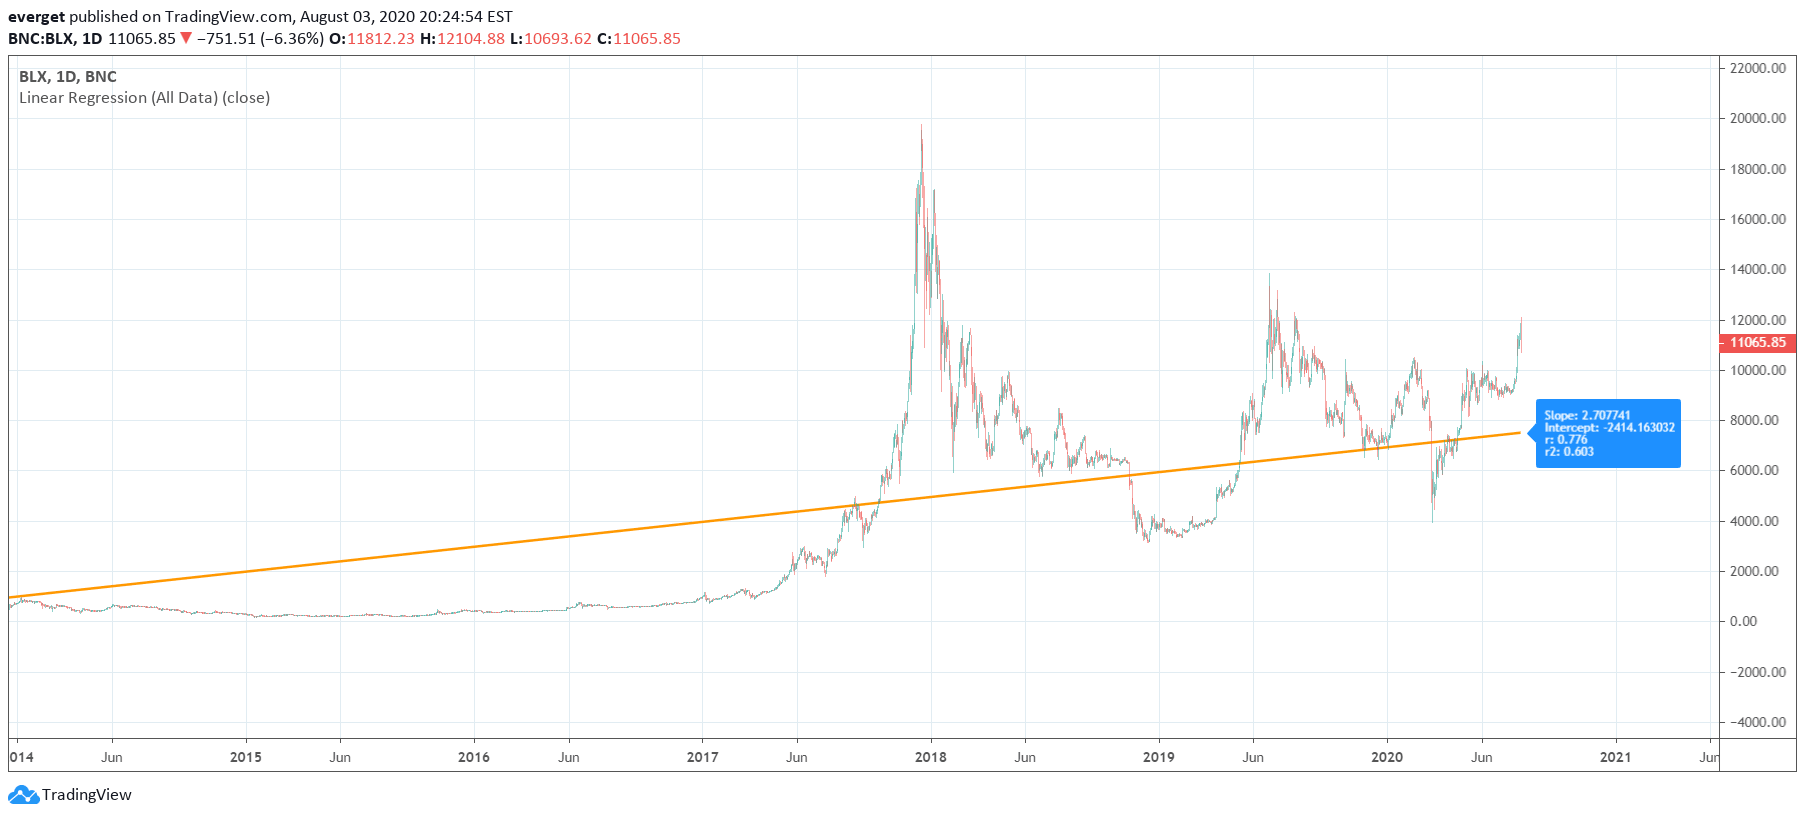
Linear regression line plots a trend indicator across an instrument's entire historical data, revealing the overall price trajectory and potential long-term directional bias.
Explore complementary indicator rolesHow it works
Linear regression is a statistical method that calculates the best-fitting straight line through a set of price data points. By using the entire historical price data, the tool creates a trend line that represents the average price movement over time.
The line is drawn to minimize the distance between the line and all the historical price points. This approach helps traders understand the overall price trajectory by smoothing out short-term fluctuations and focusing on the fundamental price trend
Why it may be useful
The linear regression line provides traders with a clear visual representation of an instrument's long-term price trend. It helps identify the primary market direction, which can be crucial for making strategic trading decisions.
By showing the overall price trajectory, traders can better understand whether an asset is trending upward, downward, or moving sideways. This information can guide entry and exit points, helping traders align their strategies with the broader market movement
When to explore it
Linear regression lines work best on daily, weekly, and monthly charts where there is sufficient historical data to create a meaningful trend line. They are particularly useful for swing traders and long-term investors who want to understand the broader market direction.
Traders should avoid using this tool on very short-term intraday timeframes, as the results might be less reliable. It is most effective when analyzing mature markets with consistent price data
Keep exploring
What we’ve verified
Access, alerts and repainting behaviour have not been independently verified for this indicator. Check the creator’s current publication and settings.
General descriptions and classifications are recovered research. Verified details above identify the specific checks we have completed. Check the creator’s current publication for later changes.