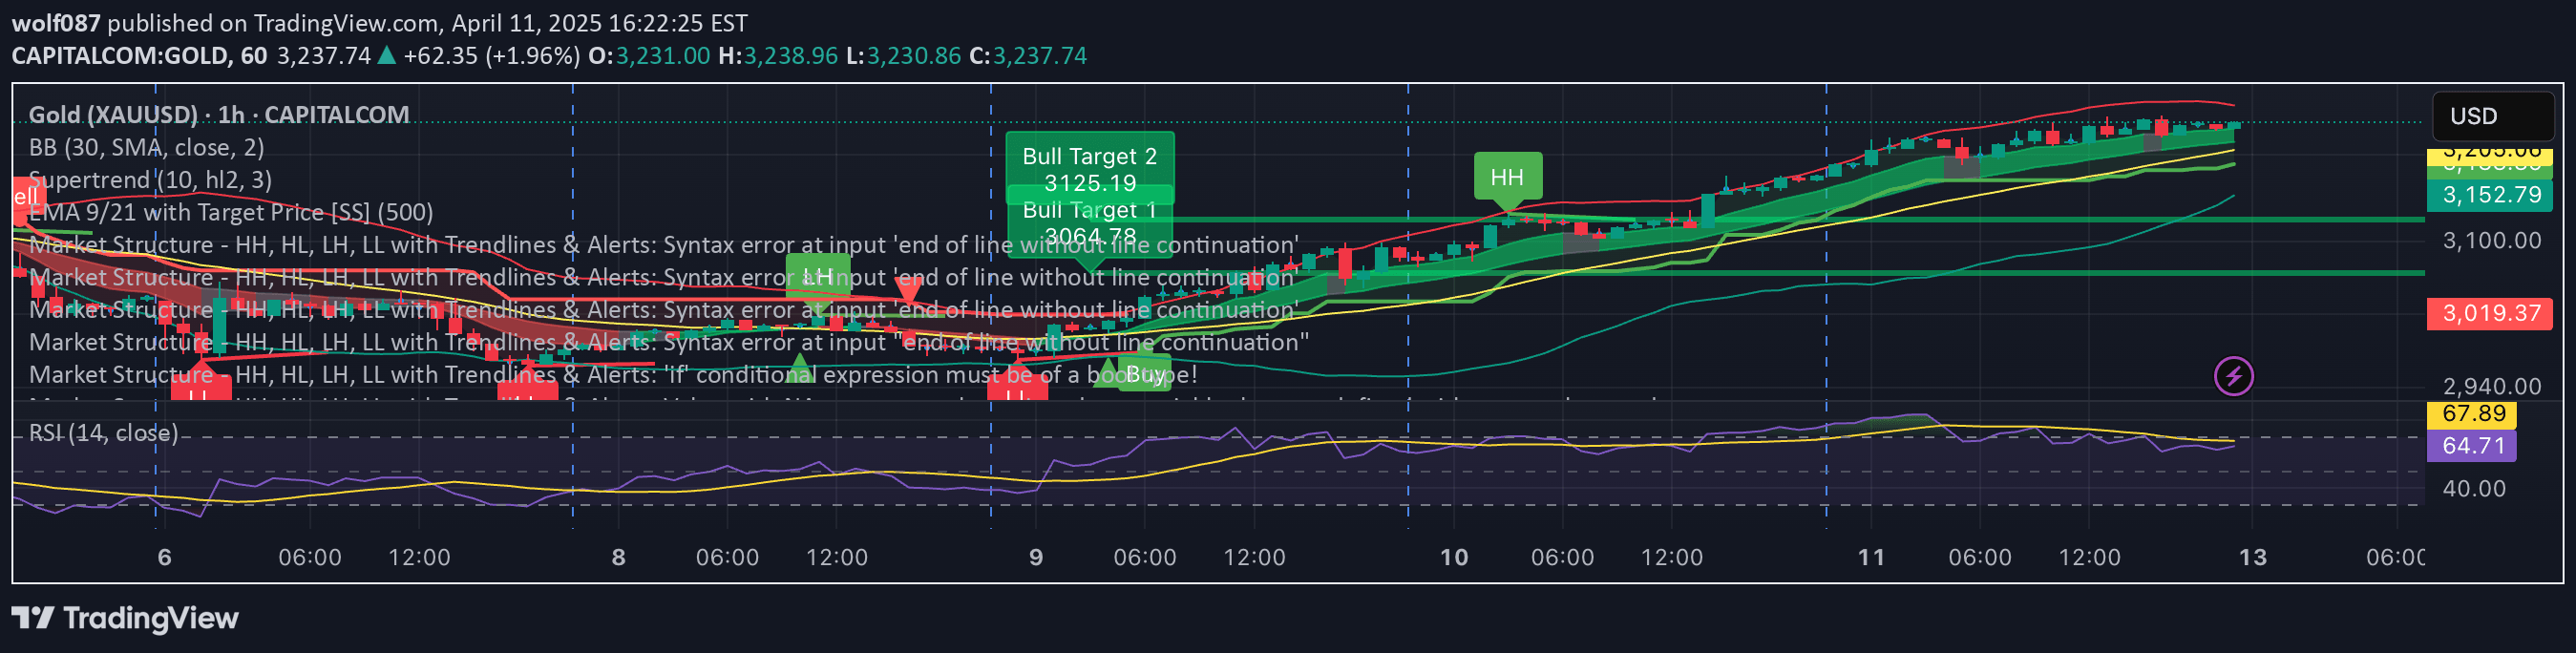
A custom indicator that plots historical high and low prices within a user-defined time interval, providing traders with a strategic overview of local price extremes across different timeframes.
Explore complementary indicator rolesHow it works
The indicator dynamically calculates and plots the highest and lowest prices for each candle within a specified time interval. Traders can configure separate lookback periods for high and low price calculations, allowing flexibility in analyzing historical price extremes.
By examining the local maximum and minimum prices, the script creates visual markers that highlight significant price levels across different timeframes. These markers are independent of the current chart's time interval, making them adaptable to various trading perspectives and timeframe transitions.
Why it may be useful
This indicator provides traders with a strategic advantage by revealing historical price extremes that might otherwise be overlooked in fast-moving or short-term charts. By displaying local high and low points, traders can quickly identify critical price levels that could serve as potential support, resistance, or trend reversal zones.
The unique flexibility of specifying time intervals in seconds, minutes, hours, or days allows traders to customize their analysis without being constrained by rigid candle-based calculations. This adaptability makes the indicator valuable for understanding market dynamics across multiple trading styles and timeframes.
When to explore it
The indicator is most effective when traders need a comprehensive view of price movements across different time intervals, particularly in volatile or rapidly changing markets. It is especially useful for identifying short-term trend dynamics, potential entry and exit points, and understanding recent price behavior.
Traders can leverage this tool in scenarios requiring quick recognition of historical price extremes, such as intraday trading, momentum strategies, and short-term trend analysis. By providing a clear visual representation of local highs and lows, the indicator helps traders make more informed decisions based on recent market context.
Keep exploring
What we’ve verified
Access, alerts and repainting behaviour have not been independently verified for this indicator. Check the creator’s current publication and settings.
General descriptions and classifications are recovered research. Verified details above identify the specific checks we have completed. Check the creator’s current publication for later changes.