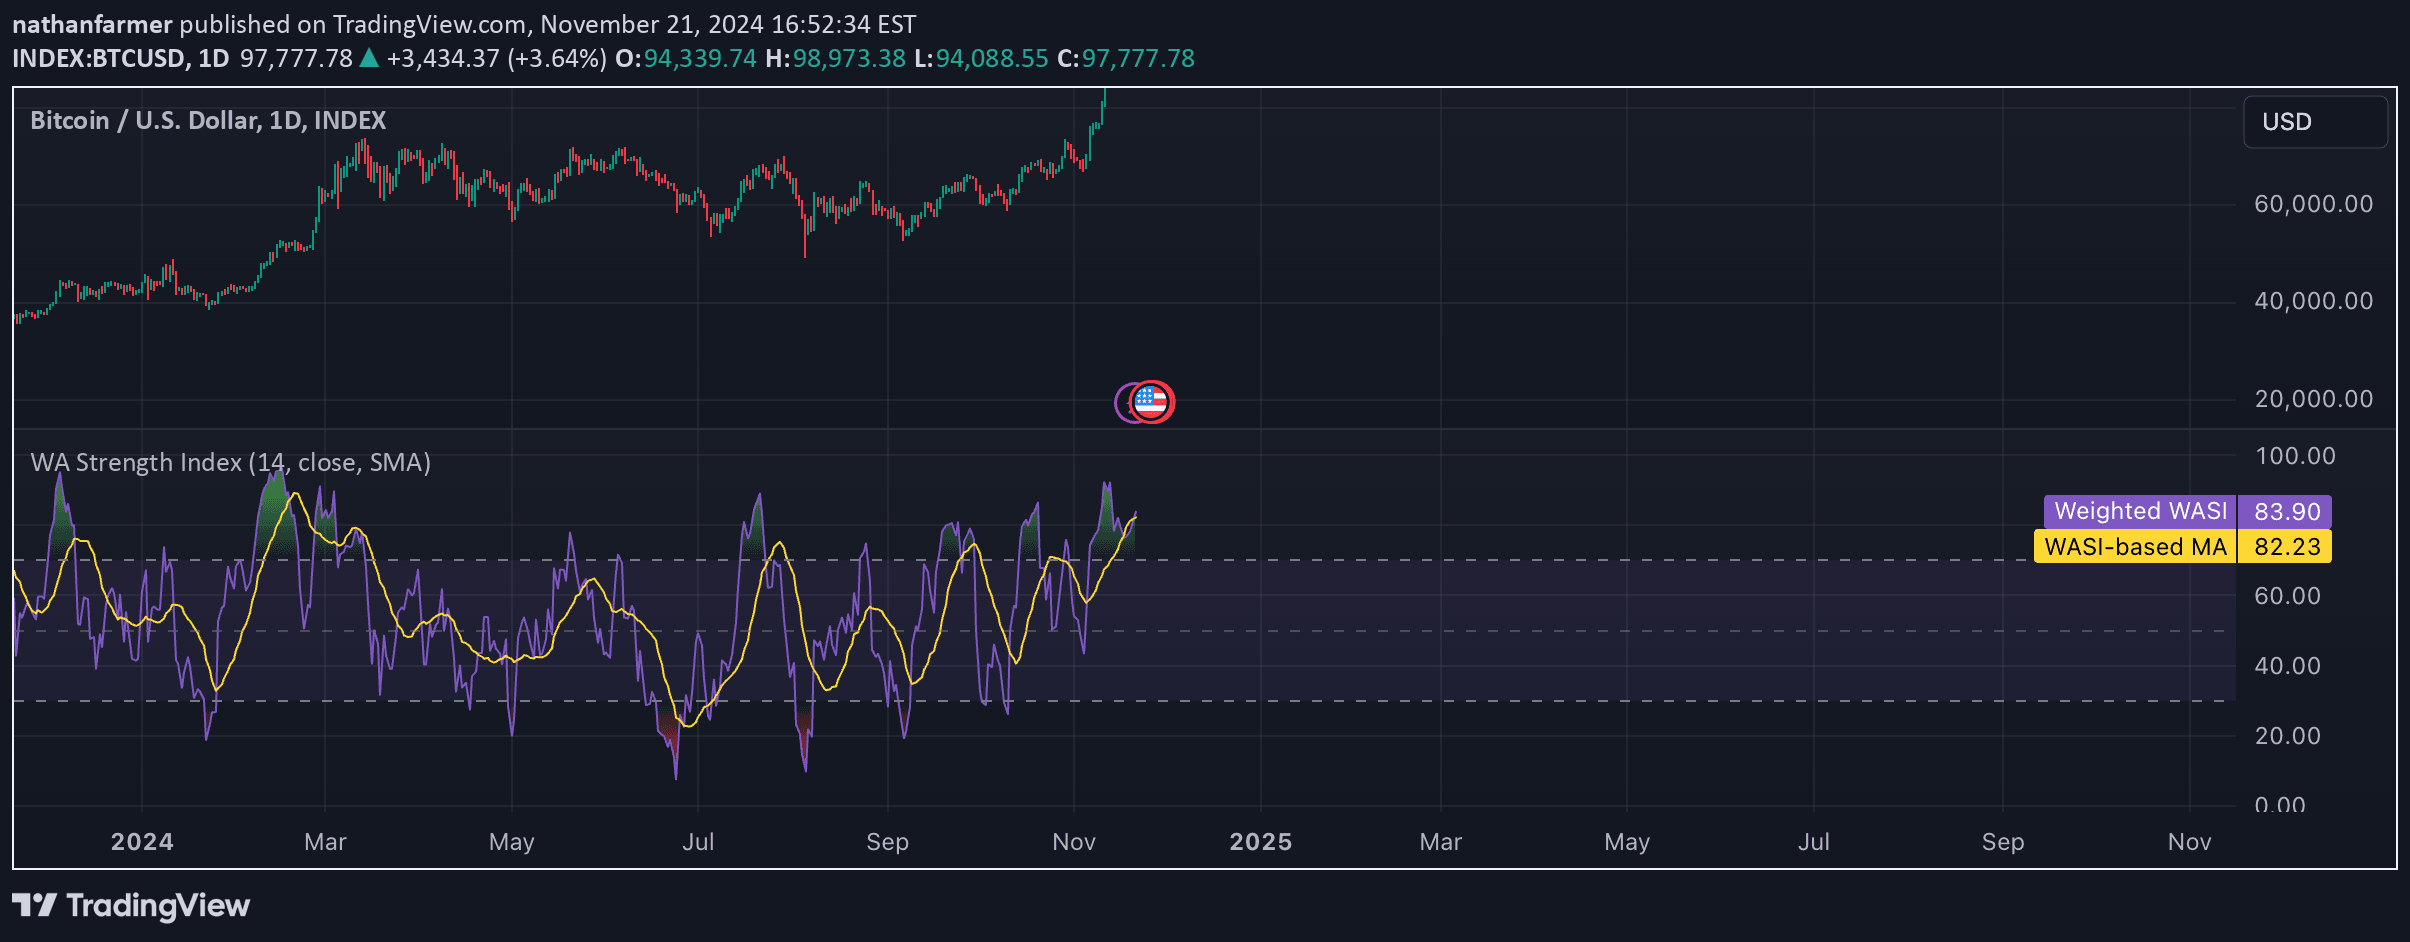
A volume-weighted RSI indicator designed to provide nuanced insights into Solana cryptocurrencies by combining momentum analysis with volume dynamics for more precise trading signals.
Explore complementary indicator rolesHow it works
The Liquidity Sensitivity Indicator (LSI) starts with a standard 14-period RSI calculation, which measures the magnitude of recent price changes to evaluate momentum. It then introduces an optional volume weighting mechanism that adjusts the RSI based on trading volume relative to its moving average.
By incorporating volume dynamics, the LSI modifies the traditional RSI to create a more comprehensive momentum indicator. This approach allows traders to see not just price momentum, but also the strength of that momentum through volume analysis, providing a more nuanced view of market conditions.
Why it may be useful
The LSI offers traders a more sophisticated approach to momentum analysis by integrating volume information into the traditional RSI calculation. This additional layer of analysis helps traders distinguish between genuine momentum moves and potentially less reliable price changes that lack substantive trading volume.
By providing a more comprehensive view of market dynamics, the LSI can help traders make more informed decisions about entry and exit points. The indicator's ability to highlight volume-confirmed momentum can be particularly valuable in volatile markets like Solana-based cryptocurrencies.
When to explore it
The LSI is most effective in markets with significant volume variations and when trading assets with complex price dynamics, such as Solana cryptocurrencies. Traders can leverage this indicator during periods of market uncertainty, where understanding both price momentum and volume is crucial for making trading decisions.
It is particularly useful for identifying potential trend reversals, confirming existing trends, and spotting divergences between price movement and volume. Traders can customize the indicator by adjusting RSI length and overbought/oversold levels to suit their specific trading strategy and market conditions.
Keep exploring
What we’ve verified
Access, alerts and repainting behaviour have not been independently verified for this indicator. Check the creator’s current publication and settings.
General descriptions and classifications are recovered research. Verified details above identify the specific checks we have completed. Check the creator’s current publication for later changes.