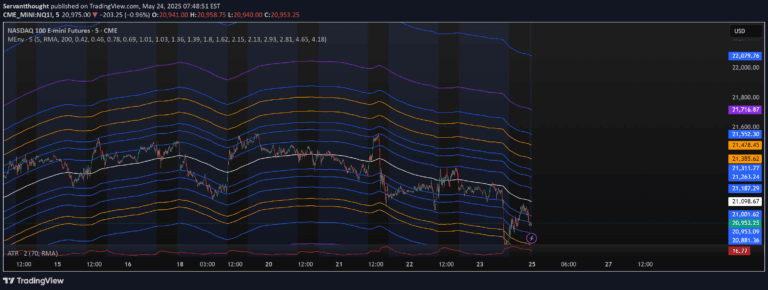
A customizable Simple Moving Average (SMA) with adjustable percentage bands that help traders visualize price trends, support, and resistance levels across different timeframes.
Explore complementary indicator rolesHow it works
The indicator calculates a Simple Moving Average (SMA) based on user-defined timeframe and length, serving as a central reference line for price analysis. From this baseline, the script generates upper and lower bands by applying percentage offsets to the SMA, creating a dynamic price channel.
Each band is mathematically derived by multiplying the SMA by specific percentage factors, allowing traders to customize the distance and visibility of these bands. Users can independently configure the timeframe, length, distance percentage, and color for both the main SMA and its surrounding bands, providing a flexible tool for technical analysis.
Why it may be useful
This indicator offers traders a comprehensive visual tool for understanding price dynamics and potential market movements by providing a flexible, customizable framework for trend analysis. By allowing precise configuration of moving average parameters, traders can adapt the indicator to various market conditions and trading styles.
The percentage-based bands help identify key price levels, potential support and resistance zones, and market volatility. This enables traders to make more informed decisions about entry and exit points, trend strength, and potential price reversals across different financial instruments and timeframes.
When to explore it
This SMA with percentage bands is most effective in markets with clear trending characteristics, where price tends to respect moving average levels and exhibit predictable range-bound behavior. It works particularly well in stocks, forex, and cryptocurrency markets with moderate volatility, where price movements show some degree of directional consistency.
Traders should utilize this indicator during periods of stable market conditions, when trend identification and support/resistance levels are crucial for making trading decisions. It is especially useful for confirming trend directions, identifying potential reversal points, and managing risk by providing a dynamic reference framework for price action.
Keep exploring
What we’ve verified
Access, alerts and repainting behaviour have not been independently verified for this indicator. Check the creator’s current publication and settings.
General descriptions and classifications are recovered research. Verified details above identify the specific checks we have completed. Check the creator’s current publication for later changes.