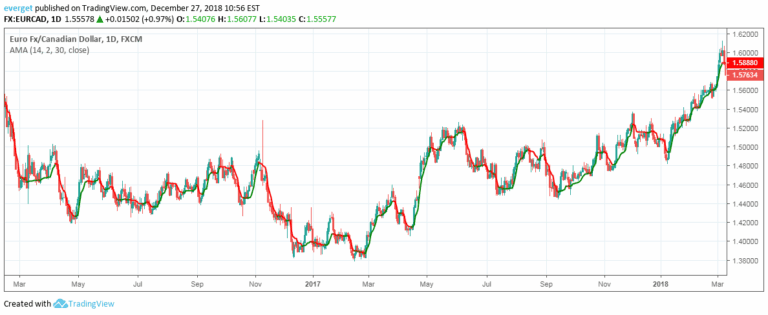
A trading indicator that calculates the average deviation rate relative to sigma, providing a simple method for tracking market movements and potential trend shifts.
Explore complementary indicator rolesHow it works
The Moving Average Deviation Rate calculates the difference between the current price and its moving average, normalized by sigma to create an indexed percentage. By dividing the average deviation rate by sigma multiplied by input sigma, traders can quantify the price's deviation from its expected range.
This method transforms raw price movements into a standardized metric that helps identify potential trend strength and market volatility. The resulting index provides a clear numerical representation of how far the price has moved from its average, making it easier to interpret market behavior.
Why it may be useful
The Moving Average Deviation Rate offers traders a straightforward way to assess market momentum and potential trend changes. By converting complex price movements into a simple percentage index, it helps traders quickly understand market dynamics without requiring advanced statistical knowledge.
This indicator can be particularly useful for identifying when prices are moving unusually far from their typical range, which might signal potential trend reversals or significant market events. Its simplicity makes it accessible to traders of all experience levels, providing a quick snapshot of market behavior.
When to explore it
The Moving Average Deviation Rate works best in markets with clear trending characteristics, such as forex, stocks, and cryptocurrency markets. It is most effective when used on timeframes that capture medium-term price movements, typically ranging from 15-minute to daily charts.
Traders should combine this indicator with other technical analysis tools to confirm signals and reduce false positives. It is particularly useful during periods of market volatility, helping traders identify potential breakout points or trend acceleration.
Keep exploring
What we’ve verified
Access, alerts and repainting behaviour have not been independently verified for this indicator. Check the creator’s current publication and settings.
General descriptions and classifications are recovered research. Verified details above identify the specific checks we have completed. Check the creator’s current publication for later changes.