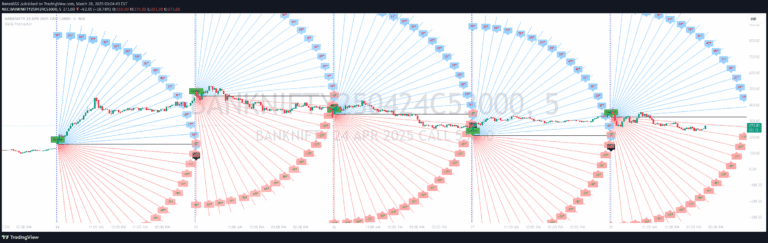
A TradingView script that analyzes market trends by calculating percentage drops from all-time high, revealing key statistical levels and potential support/resistance zones.
Explore complementary indicator rolesHow it works
The script tracks a financial instrument's price history to calculate significant statistical levels including all-time high (ATH) and all-time low (ATL). It systematically analyzes price movements by tracking percentage drops from peak prices and storing these values in an array for comprehensive analysis.
By utilizing sophisticated calculation methods, the script generates mean and median values of price retracements. It then plots these levels on the chart, creating visual representations of key price thresholds and potential support/resistance zones that traders can easily interpret.
Why it may be useful
This indicator provides traders with a nuanced understanding of historical price behavior by revealing critical statistical levels beyond traditional technical analysis. By displaying percentage drops and key reference points, it helps traders contextualize current price movements against historical performance and identify potential trend reversals.
The script's dynamic visualization allows traders to quickly assess market sentiment, understand historical volatility, and make more informed trading decisions based on comprehensive price data. Its customizable features enable adaptation to different trading styles and market conditions.
When to explore it
The indicator is most effective when analyzing markets with established price histories and potential trending characteristics. It works best for traders seeking to understand long-term price dynamics and identify significant retracement levels across various financial instruments.
Traders can utilize this tool during periods of market consolidation or when examining potential entry and exit points in trending markets. It is particularly useful for developing a strategic approach to understanding price movements and identifying potential support and resistance zones.
Keep exploring
What we’ve verified
Access, alerts and repainting behaviour have not been independently verified for this indicator. Check the creator’s current publication and settings.
General descriptions and classifications are recovered research. Verified details above identify the specific checks we have completed. Check the creator’s current publication for later changes.