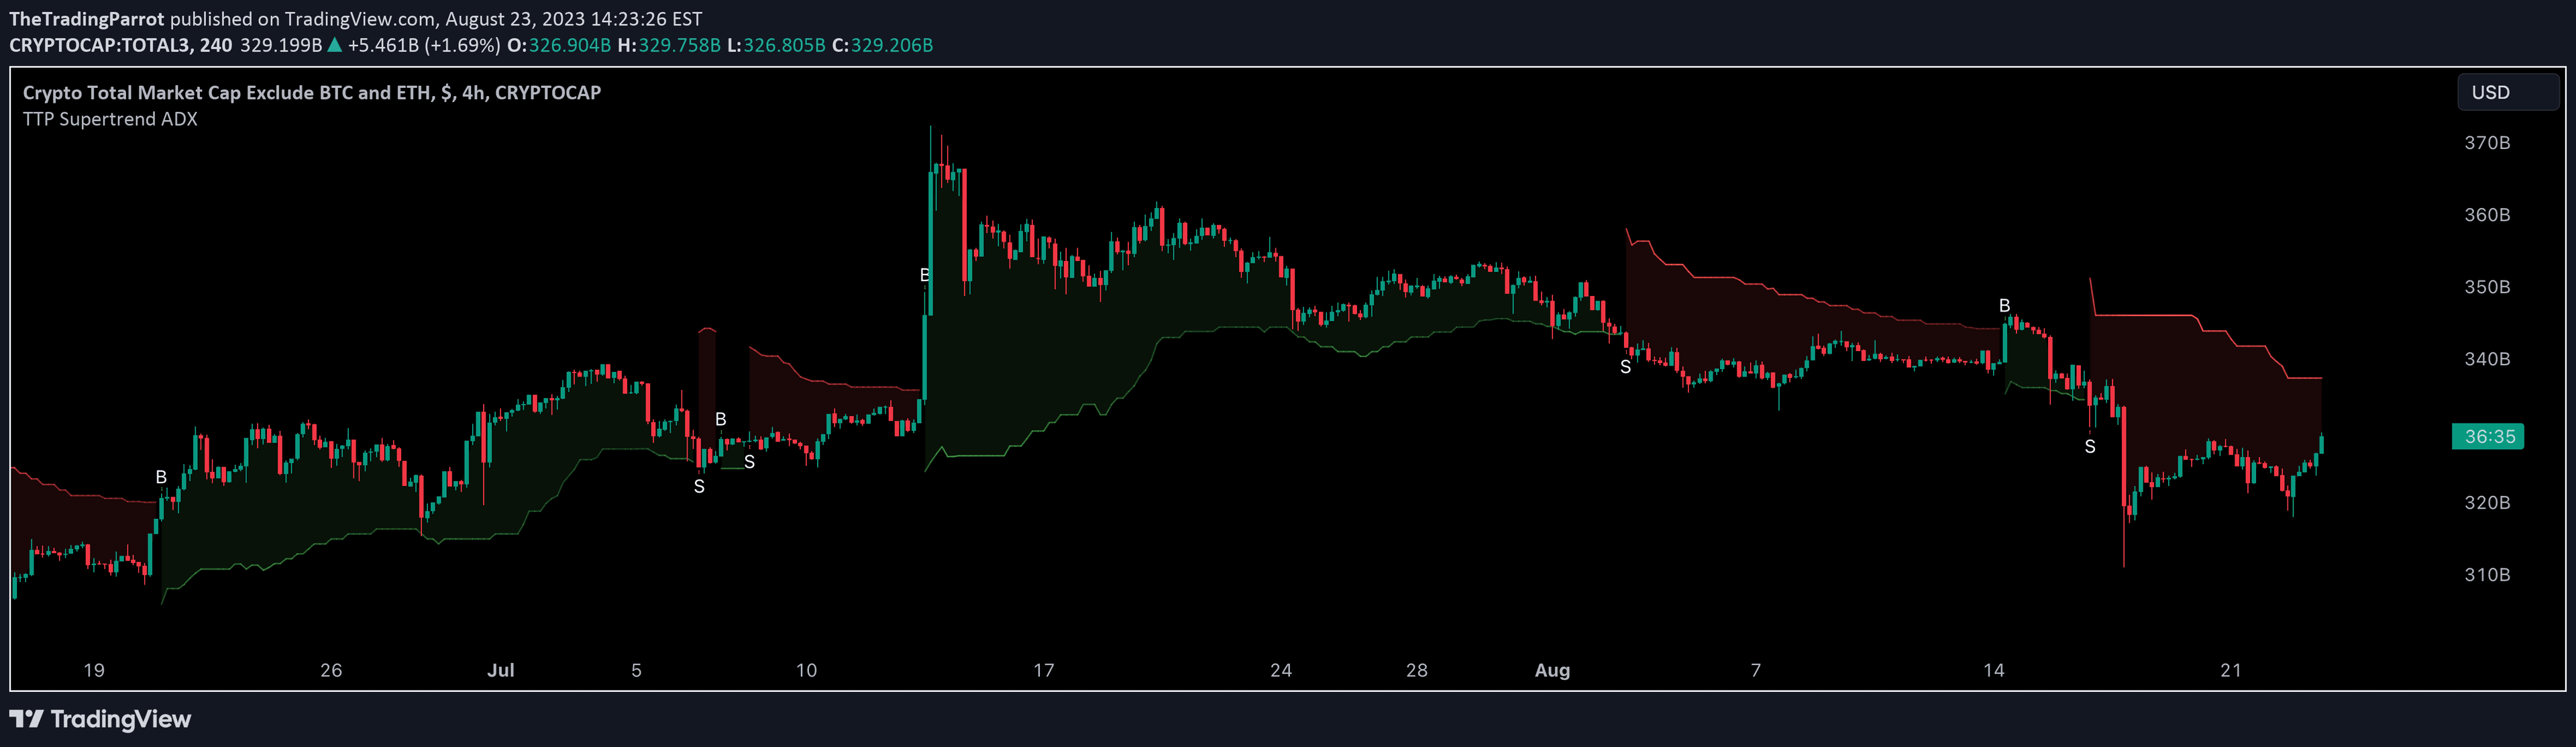
A trading indicator that visually represents market direction by comparing price to a higher timeframe moving average, color-coding market conditions for quick trend identification.
Explore complementary indicator rolesHow it works
The Market Trend indicator operates by comparing the current price to a higher timeframe moving average to determine market direction. When price trades above the moving average, the background turns green, signaling an uptrend. Conversely, when price falls below the moving average, the background shifts to red, indicating a downtrend.
During periods of reduced volatility or sideways price action, the background becomes gray, suggesting a consolidation phase. This visual approach allows traders to quickly interpret market conditions without complex calculations or multiple indicator overlays.
Why it may be useful
The Market Trend indicator simplifies trend identification by providing an immediate visual representation of market direction. By using color-coded backgrounds, traders can rapidly assess whether the current market environment is bullish, bearish, or range-bound, enabling faster decision-making and potential risk management.
This tool is particularly valuable for traders who prefer a straightforward, at-a-glance approach to understanding market dynamics. It reduces the cognitive load of interpreting multiple technical indicators by presenting trend information in an intuitive, easily digestible format.
When to explore it
The Market Trend indicator is most effective in markets with clear directional movements, such as during strong trending periods in stocks, forex, or commodities. Traders can use this tool across various timeframes, from short-term scalping to longer-term swing trading, making it versatile for different trading strategies.
However, traders should exercise caution during choppy or highly volatile market conditions where trend signals might be less reliable. It is recommended to combine this indicator with other technical analysis tools, such as volume indicators or momentum oscillators, to confirm signals and improve overall trading accuracy.
Keep exploring
What we’ve verified
Access, alerts and repainting behaviour have not been independently verified for this indicator. Check the creator’s current publication and settings.
General descriptions and classifications are recovered research. Verified details above identify the specific checks we have completed. Check the creator’s current publication for later changes.