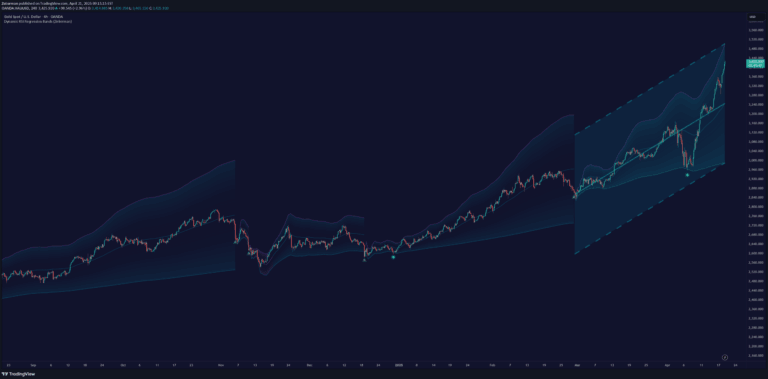
A Nadaraya-Watson kernel regression indicator that uses two trend estimates to generate potential trading signals based on crossover and crossunder conditions.
Explore complementary indicator rolesHow it works
The kernel regression indicator uses two specialized functions to estimate market trends through the Nadaraya-Watson non-parametric regression method. It calculates weighted trend estimates using specific kernel parameters, creating two trend lines that interact with each other to generate potential trading signals.
The indicator compares two trend estimates (yhat1 and yhat2) to identify crossover and crossunder points. When yhat1 crosses above yhat2, it generates a buy signal, and when yhat1 crosses below yhat2, it generates a sell signal, providing traders with potential entry and exit points.
Why it may be useful
The kernel regression method offers a sophisticated approach to trend analysis by using non-parametric regression techniques that can adapt to changing market conditions. It provides a more flexible and dynamic way of identifying potential trend shifts compared to traditional moving average or linear regression methods.
By combining two different trend estimates, the indicator helps traders gain insights into market momentum and potential trend reversals. The adaptive nature of the kernel regression allows for more nuanced trend detection, potentially reducing false signals and improving trade decision-making.
When to explore it
This indicator works best in markets with clear trending characteristics, where price movements show consistent directional momentum. It is particularly effective when used in conjunction with other technical analysis tools and when traders are looking for more sophisticated trend identification methods.
Traders should use this signal as part of a comprehensive trading strategy, considering additional confirmation from volume, support and resistance levels, and other technical indicators. It is most suitable for traders who want a more advanced, adaptive approach to trend analysis and are comfortable with complex statistical methods.
Keep exploring
What we’ve verified
Access, alerts and repainting behaviour have not been independently verified for this indicator. Check the creator’s current publication and settings.
General descriptions and classifications are recovered research. Verified details above identify the specific checks we have completed. Check the creator’s current publication for later changes.