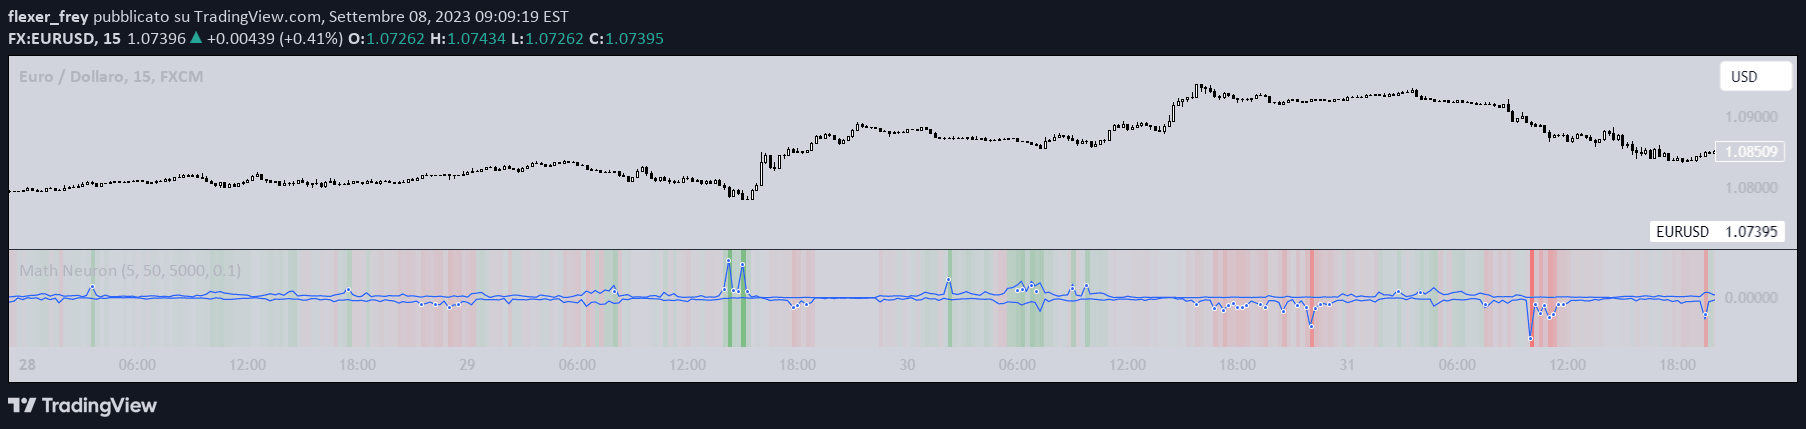
A neural network-based trading signal that uses RSI of close and volume to predict potential pivot highs and lows, employing a two-input neuron with sigmoid activation.
Explore complementary indicator rolesHow it works
The signal leverages a mathematical neuron model with two inputs: the 14-period RSI of closing prices and trading volume. It calculates weights and a bias to process these inputs through a sigmoid activation function, creating a binary prediction mechanism.
By analyzing the RSI of both price and volume, the neural network attempts to identify potential pivot points in the market. The sigmoid activation transforms the weighted inputs into a probability-based signal, helping traders anticipate potential high or low price reversals based on historical market behavior.
Why it may be useful
This neural network-based signal provides traders with a sophisticated, data-driven approach to market prediction by combining multiple technical indicators into a single predictive model. It offers a more complex analytical method that goes beyond traditional single-indicator strategies, potentially capturing more nuanced market dynamics.
By integrating RSI of both price and volume, the signal can provide insights into market momentum and potential trend reversals that might be missed by conventional trading indicators. Its binary output allows for clear, actionable trading decisions based on mathematical probability.
When to explore it
The signal is most effective in markets with clear momentum and consistent volume patterns, making it particularly useful for short-term trading strategies like scalping and day trading. Traders should apply it in liquid markets with sufficient trading volume to ensure reliable signal generation.
Best used in conjunction with other technical analysis tools, this signal can help identify potential entry and exit points during periods of market volatility. It is particularly valuable when traditional indicators might provide conflicting or unclear signals, offering an alternative perspective on market movements.
Keep exploring
What we’ve verified
Access, alerts and repainting behaviour have not been independently verified for this indicator. Check the creator’s current publication and settings.
General descriptions and classifications are recovered research. Verified details above identify the specific checks we have completed. Check the creator’s current publication for later changes.