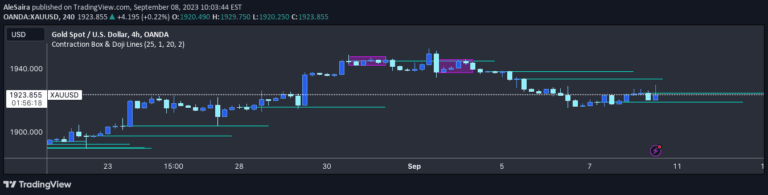
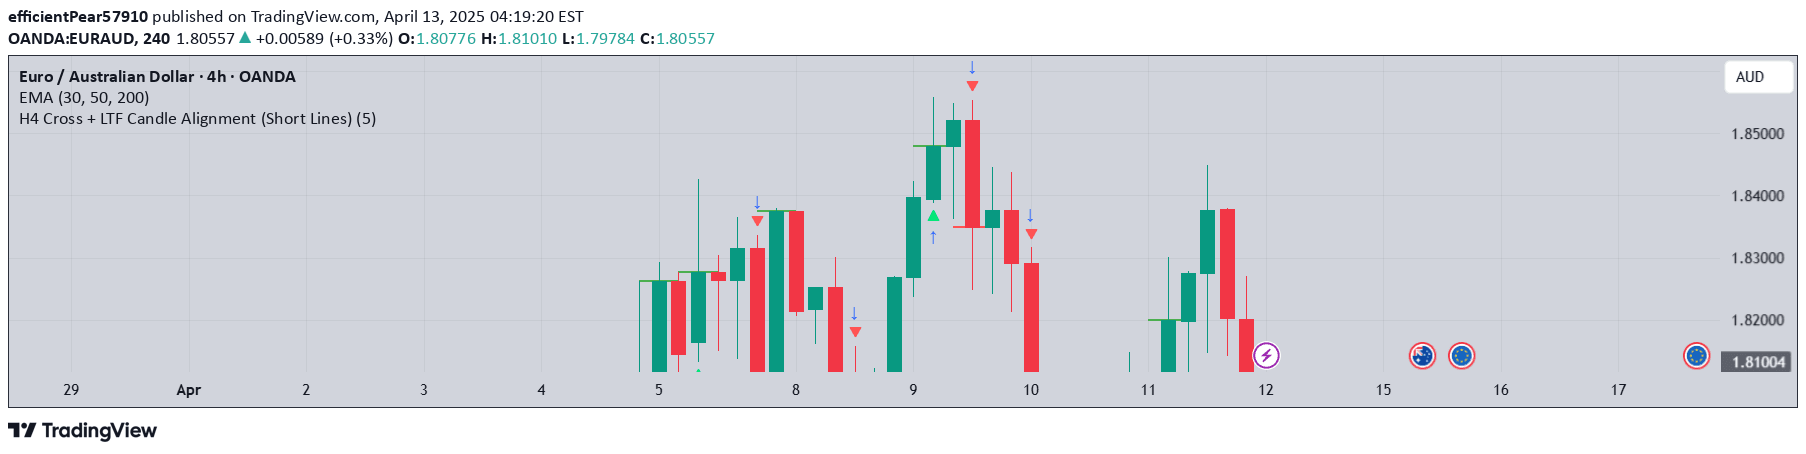
A pattern recognition technique that identifies high and low points by analyzing candlestick breakouts across three or five candlestick intervals.
Explore complementary indicator rolesHow it works
This signal identifies potential market turning points by tracking candlestick shadow breaks across multiple timeframes. For a three-candlestick pattern, it examines one candle before and one candle after the target candle, analyzing how shadows interact with price levels.
In a five-candlestick pattern, the analysis expands to two candles before and two candles after, providing a more comprehensive view of potential price reversals. The methodology focuses on detecting critical moments where candlestick shadows breach significant price thresholds, indicating potential trend changes or momentum shifts.
Why it may be useful
This signal provides traders with a systematic approach to identifying potential market reversals and trend continuation points. By focusing on candlestick shadow breaks, traders can gain insights into market sentiment and potential price movements beyond traditional price action analysis.
The method offers a granular perspective on market dynamics, allowing traders to make more informed decisions about entry and exit points. It helps traders understand subtle price movements and potential trend shifts that might be overlooked by more conventional technical analysis methods.
When to explore it
This signal is most effective in markets with clear, identifiable price trends and consistent candlestick formations. It works best in timeframes that allow for clear visualization of candlestick patterns, such as intraday and short-term trading scenarios.
Traders should apply this signal in markets with sufficient liquidity and volatility, where candlestick patterns can provide meaningful insights into potential price movements. It is particularly useful for traders seeking to identify early signs of trend reversals or continuation patterns.
Keep exploring
What we’ve verified
Access, alerts and repainting behaviour have not been independently verified for this indicator. Check the creator’s current publication and settings.
General descriptions and classifications are recovered research. Verified details above identify the specific checks we have completed. Check the creator’s current publication for later changes.