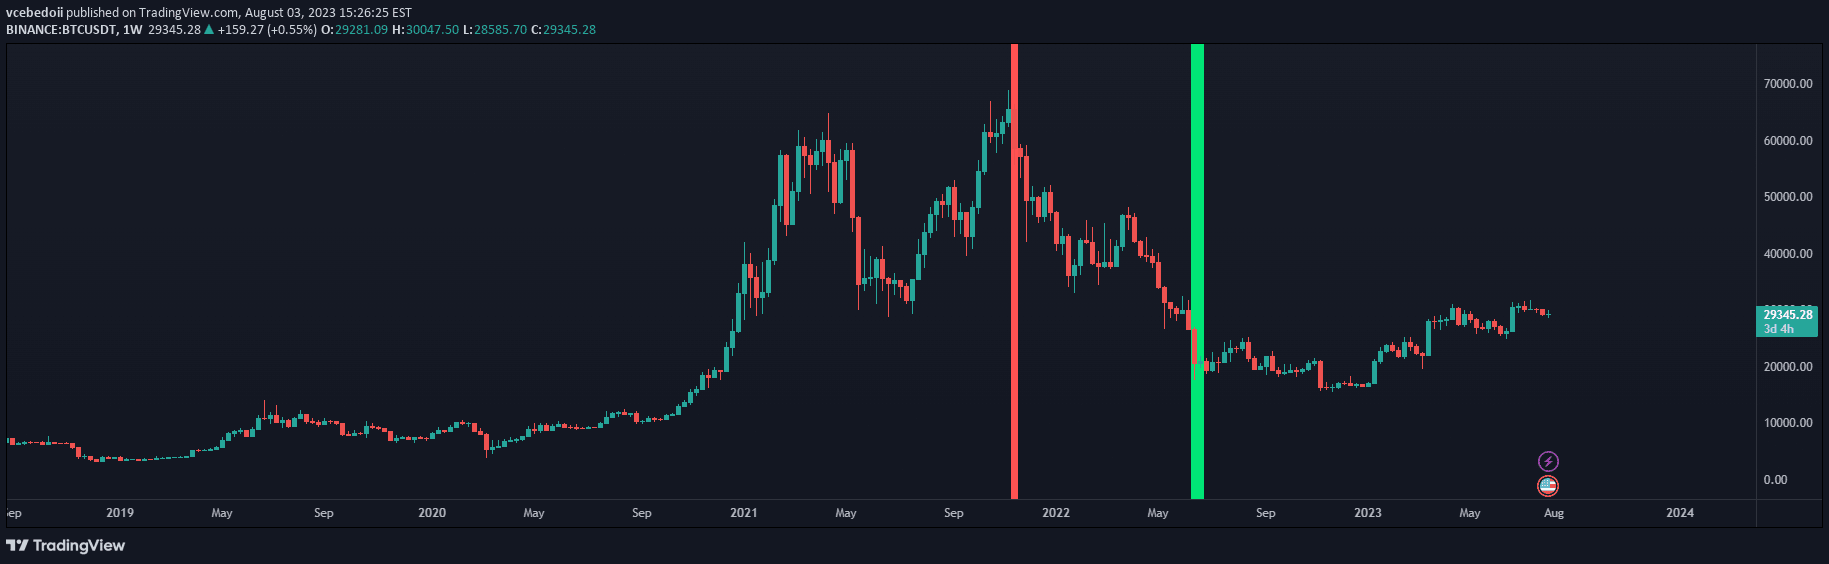
An AI-powered trading indicator for BTC/USDT that combines multi-timeframe EMA analysis with RSI and volume to generate sophisticated market trend signals.
Explore complementary indicator rolesHow it works
The MBAND indicator functions by synthesizing Exponential Moving Averages (EMAs) from multiple timeframes, treating each timeframe's EMA as a neural network input node. It creates weighted bands that represent market momentum and trend direction by analyzing price movements across different time intervals.
By integrating RSI and volume data, the indicator adds confirmation layers to its signals. The system evaluates price positions relative to the MBAND bands, using neural network-inspired techniques to assess market strength, potential trend continuations, and possible reversal points with sophisticated multi-dimensional analysis.
Why it may be useful
The MBAND indicator represents a groundbreaking approach to market analysis by leveraging artificial intelligence principles in trading strategy development. By mimicking neural network decision-making processes, it provides traders with a more nuanced and comprehensive view of market dynamics that traditional indicators cannot achieve.
Its multi-dimensional approach allows traders to gain deeper insights into market trends, momentum, and potential reversals. The integration of multiple data points and timeframes enables more informed trading decisions, reducing the likelihood of false signals and providing a more robust framework for understanding complex market movements.
When to explore it
The MBAND indicator is most effective in cryptocurrency markets with significant price movements, particularly for BTC/USDT trading. It works best when traders need a comprehensive view of market trends across multiple timeframes, from short-term day trading to longer swing trading strategies.
Traders should utilize this indicator when seeking confirmation of trend strength, looking to identify potential entry and exit points, or wanting to understand underlying market momentum. It is particularly useful during periods of market volatility, where its multi-layered analysis can provide more reliable signals compared to single-dimensional indicators.
Keep exploring
What we’ve verified
Access, alerts and repainting behaviour have not been independently verified for this indicator. Check the creator’s current publication and settings.
General descriptions and classifications are recovered research. Verified details above identify the specific checks we have completed. Check the creator’s current publication for later changes.