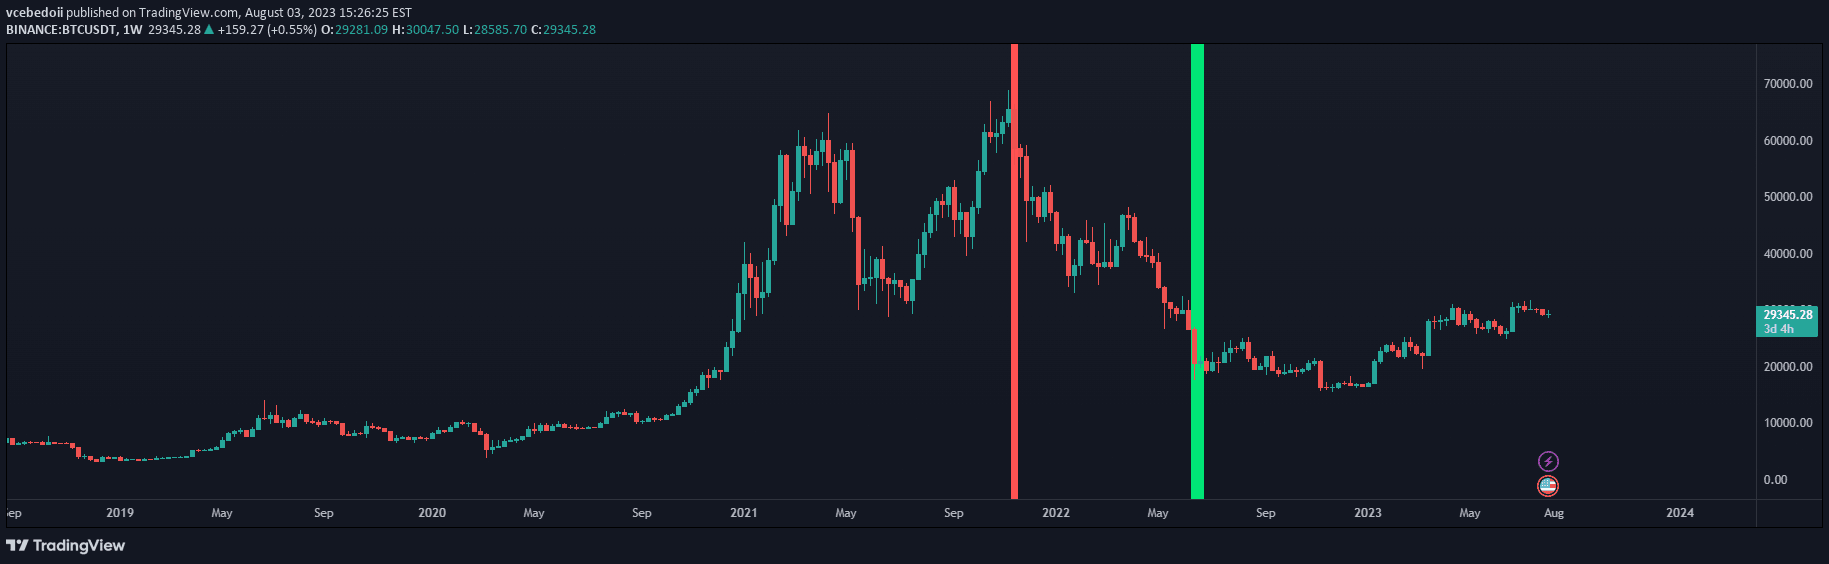
A dynamic SMA color-coding strategy that uses RSI and CCI to indicate trend strength and potential market momentum based on specific indicator levels.
Explore complementary indicator rolesHow it works
The signal modifies the Simple Moving Average (SMA) line color based on two key momentum oscillators: the Relative Strength Index (RSI) and the Commodity Channel Index (CCI). When the RSI falls below 50 and the CCI drops below zero, the SMA line turns red, signaling potential bearish market conditions.
Conversely, when the RSI rises above 50 and the CCI moves above zero, the SMA line switches to green, indicating potential bullish market momentum. In scenarios where these specific conditions are not met, the SMA line remains gray, suggesting neutral or uncertain market conditions.
Why it may be useful
This color-coded SMA strategy provides traders with a quick visual representation of market momentum and trend strength without requiring complex interpretation. By integrating two different oscillators, the signal offers a more nuanced view of market dynamics than relying on a single indicator.
The approach helps traders rapidly assess potential trend shifts and make more informed trading decisions by combining the momentum insights of RSI with the trend confirmation provided by CCI. The color-coding mechanism allows for instant recognition of market conditions, reducing cognitive load during fast-moving trading scenarios.
When to explore it
This signal works best in markets with clear momentum trends and when traders want a simple, visual method to assess market conditions. It is particularly effective in volatile markets where quick trend identification can provide a competitive edge in decision-making.
The strategy is most suitable for shorter timeframes like scalping and day trading, where rapid trend identification is crucial. Traders should combine this signal with other technical analysis tools to confirm signals and reduce the risk of false interpretations.
Keep exploring
What we’ve verified
Access, alerts and repainting behaviour have not been independently verified for this indicator. Check the creator’s current publication and settings.
General descriptions and classifications are recovered research. Verified details above identify the specific checks we have completed. Check the creator’s current publication for later changes.