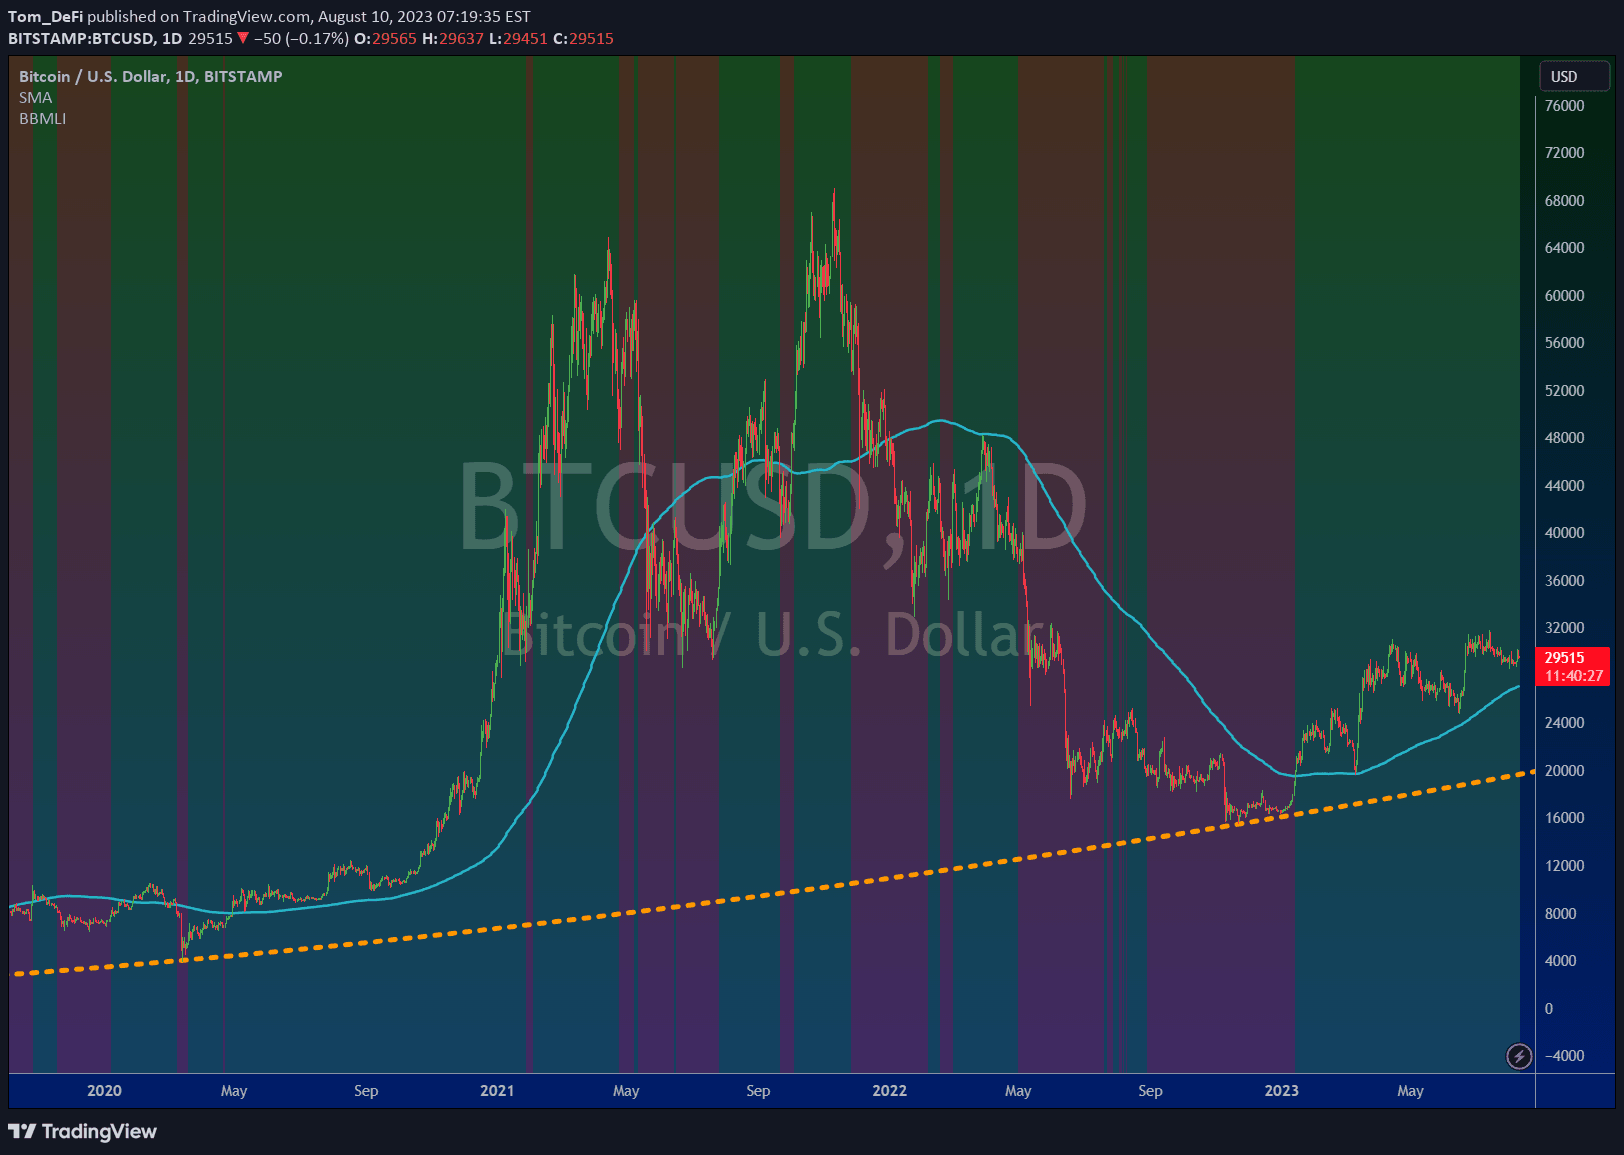
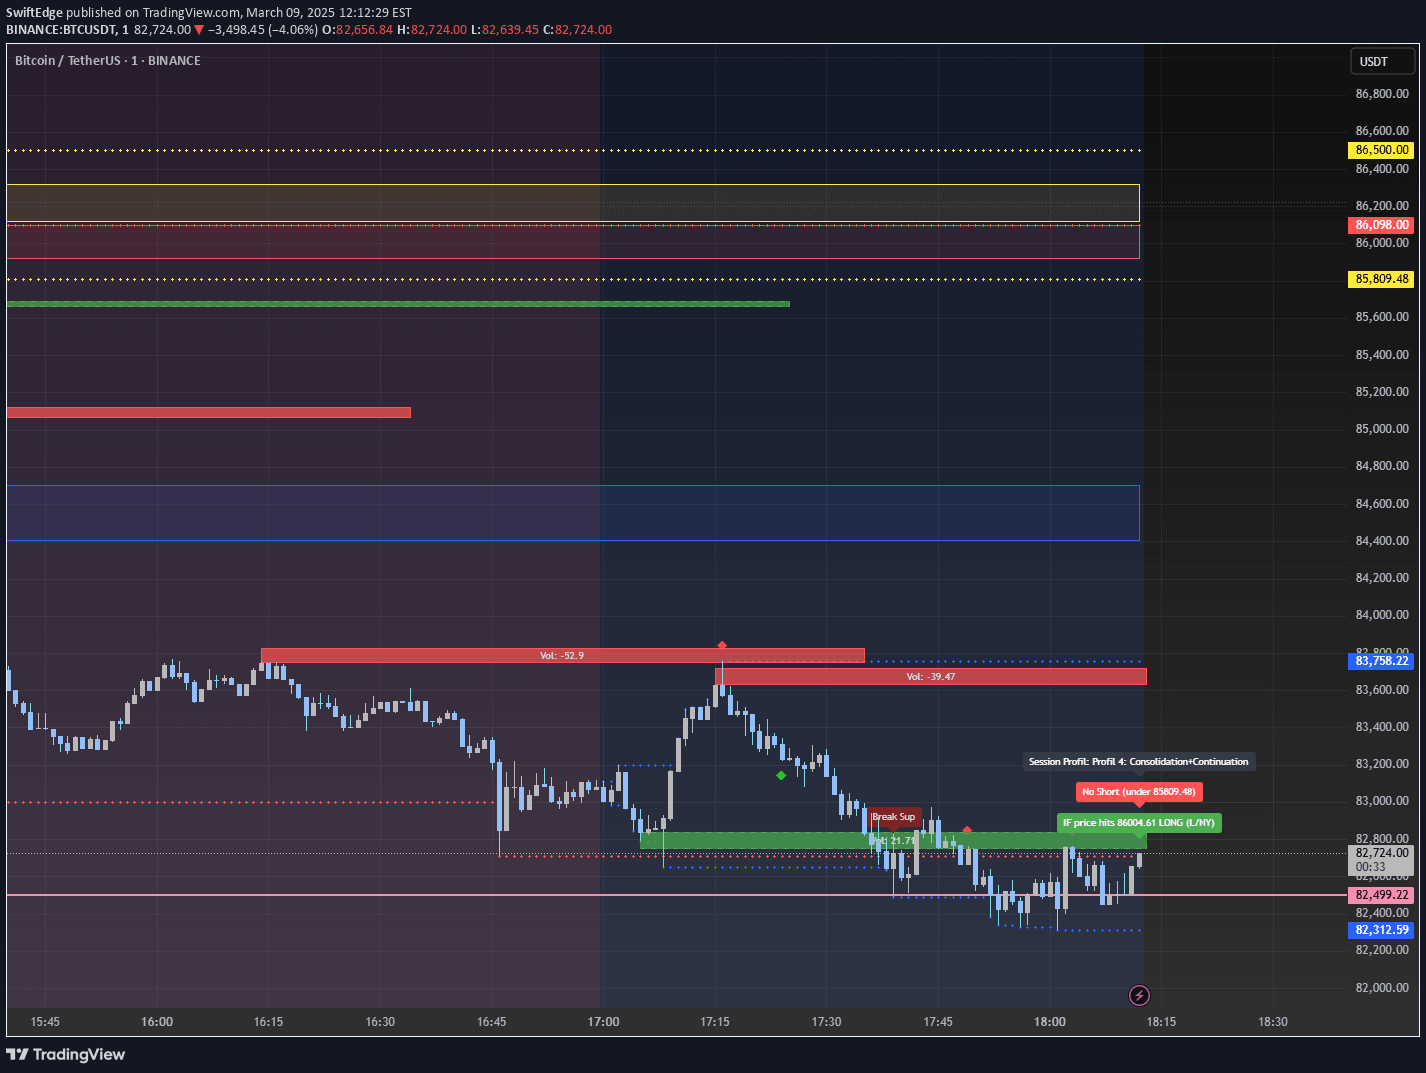
A unique market analysis tool marking McDonald's McRib release dates on trading charts to provide historical reference points and potential market insights.
Explore complementary indicator rolesHow it works
The McRib Bull Market Indicator functions by overlaying precise yellow labels on trading charts to mark historical McRib sandwich release dates from 2012 to 2024. These labels are strategically positioned above price candles, providing a visual representation of specific temporal reference points across different market timeframes.
Traders can add the indicator to any chart by searching for its name, which automatically displays the yellow markers corresponding to verified McRib release dates. The indicator covers both U.S. and international releases, offering a comprehensive view of potential market correlations during these specific periods.
Why it may be useful
The McRib Bull Market Indicator provides traders with a unique perspective on market historical analysis by introducing unconventional reference points that can spark deeper market research and psychological insights. By marking specific dates, traders can explore potential correlations between promotional events and market movements, encouraging a more creative approach to technical analysis.
This indicator challenges traditional market analysis by introducing an unexpected variable, potentially revealing subtle market behavior patterns that might otherwise go unnoticed. It encourages traders to think beyond conventional indicators and explore innovative ways of understanding market dynamics and potential cyclical trends.
When to explore it
The McRib Bull Market Indicator is most effective when used as a supplementary tool for broader market analysis, particularly for traders interested in exploring unique historical reference points and potential market psychology insights. It works best when integrated with other technical and fundamental analysis methods, providing an additional layer of contextual information.
Traders should consider using this indicator during swing trading scenarios, where longer-term market trends and historical patterns are being examined. It is particularly useful for researchers and analysts who appreciate unconventional approaches to market study and are looking to identify potential correlations between seemingly unrelated events and market movements.
Keep exploring
What we’ve verified
Access, alerts and repainting behaviour have not been independently verified for this indicator. Check the creator’s current publication and settings.
General descriptions and classifications are recovered research. Verified details above identify the specific checks we have completed. Check the creator’s current publication for later changes.