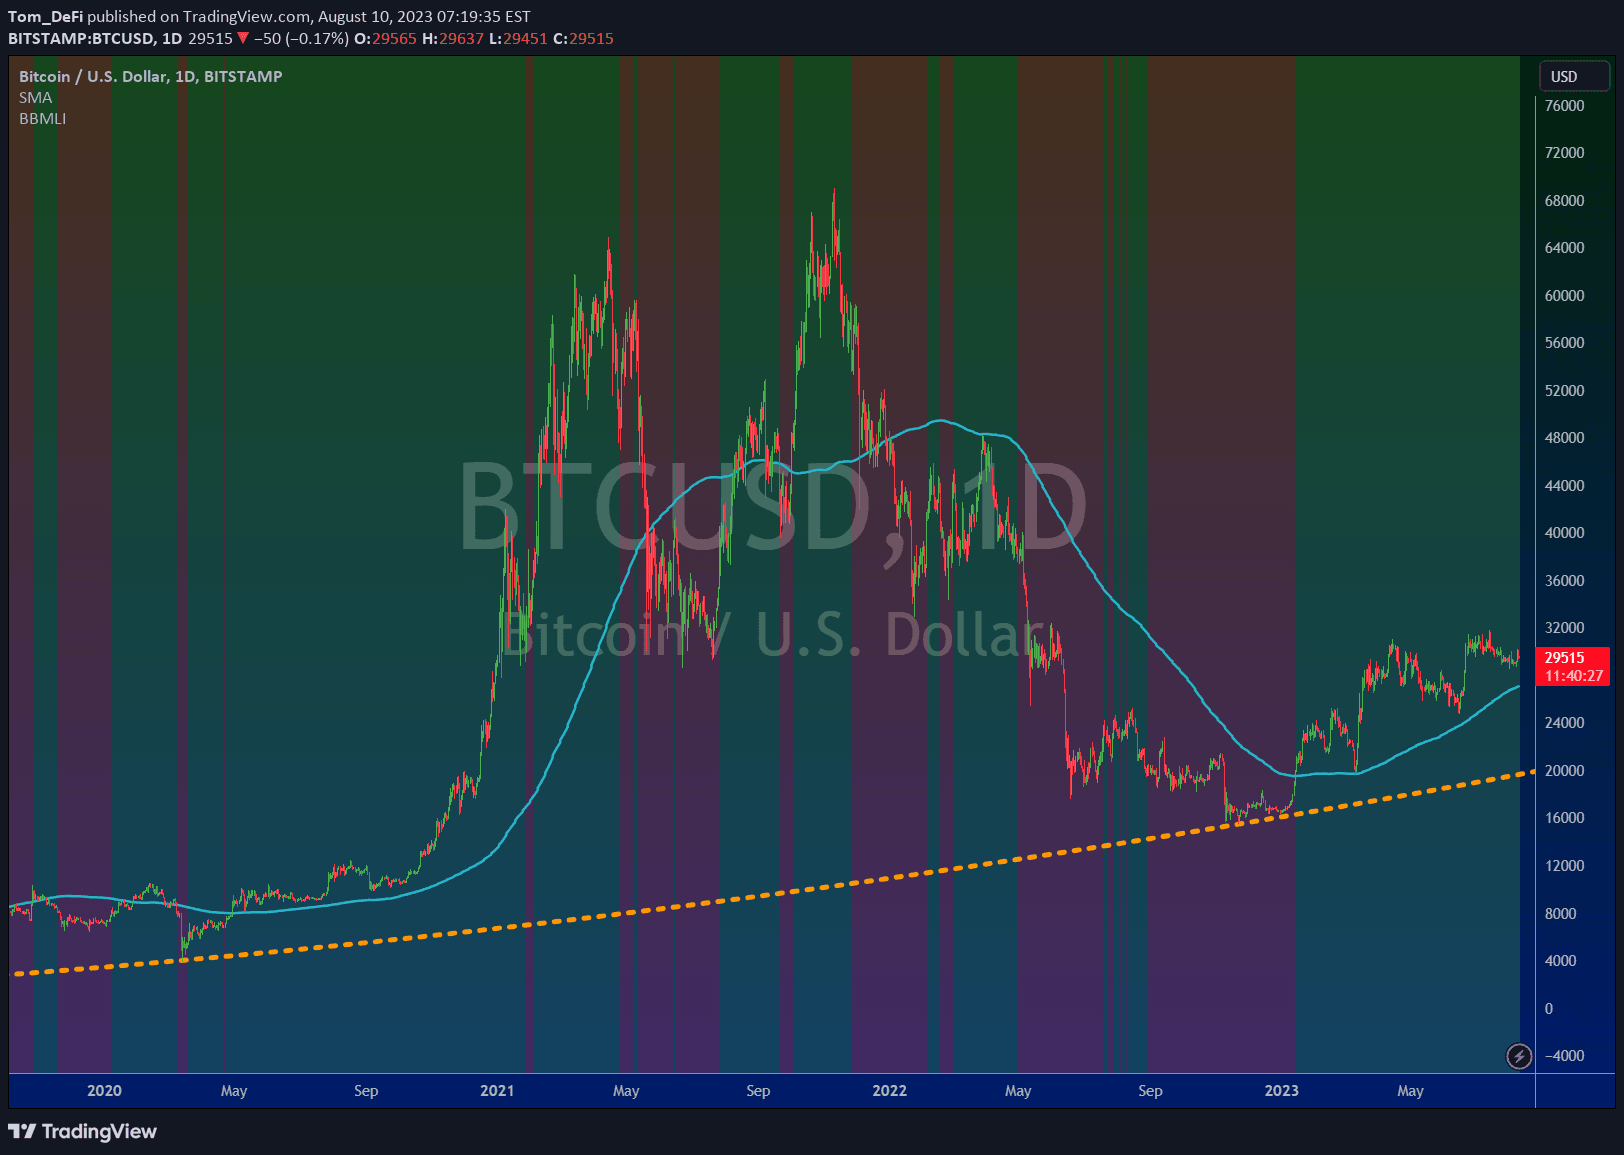
A market trend indicator defining bear and bull markets using a 20% price change rule over specific time durations on daily charts.
Explore complementary indicator rolesHow it works
The indicator tracks price movements by comparing current prices to recent market highs and lows using a percentage-based approach. It defines a bear market as an asset trading 20% below its recent high for more than two months, which is measured across approximately 60 trading days on a daily timeframe.
Conversely, a bull market is identified when an asset trades 20% above its recent low for one month or more, typically represented by 20 trading days. The calculation relies on a daily timeframe to accurately capture market trend transitions and provide a comprehensive view of market sentiment.
Why it may be useful
This signal helps traders identify significant market trend changes by providing a systematic method for recognizing bear and bull market conditions. By using a percentage-based threshold, it offers a more objective approach to understanding market transitions beyond subjective interpretations.
The indicator allows investors to make informed decisions about portfolio allocation, risk management, and potential investment strategies during different market phases. It provides a clear, quantitative framework for understanding when market sentiment shifts from bearish to bullish or vice versa.
When to explore it
The indicator is most effective for swing traders and long-term investors seeking to understand broader market trends and potential strategic shifts. It works best on daily charts where longer-term market movements can be accurately tracked and analyzed.
Traders should use this signal when looking to make significant portfolio adjustments, evaluate overall market conditions, or develop longer-term investment strategies. It is particularly useful for investors who want a systematic approach to identifying major market trend changes beyond short-term price fluctuations.
Keep exploring
What we’ve verified
Access, alerts and repainting behaviour have not been independently verified for this indicator. Check the creator’s current publication and settings.
General descriptions and classifications are recovered research. Verified details above identify the specific checks we have completed. Check the creator’s current publication for later changes.