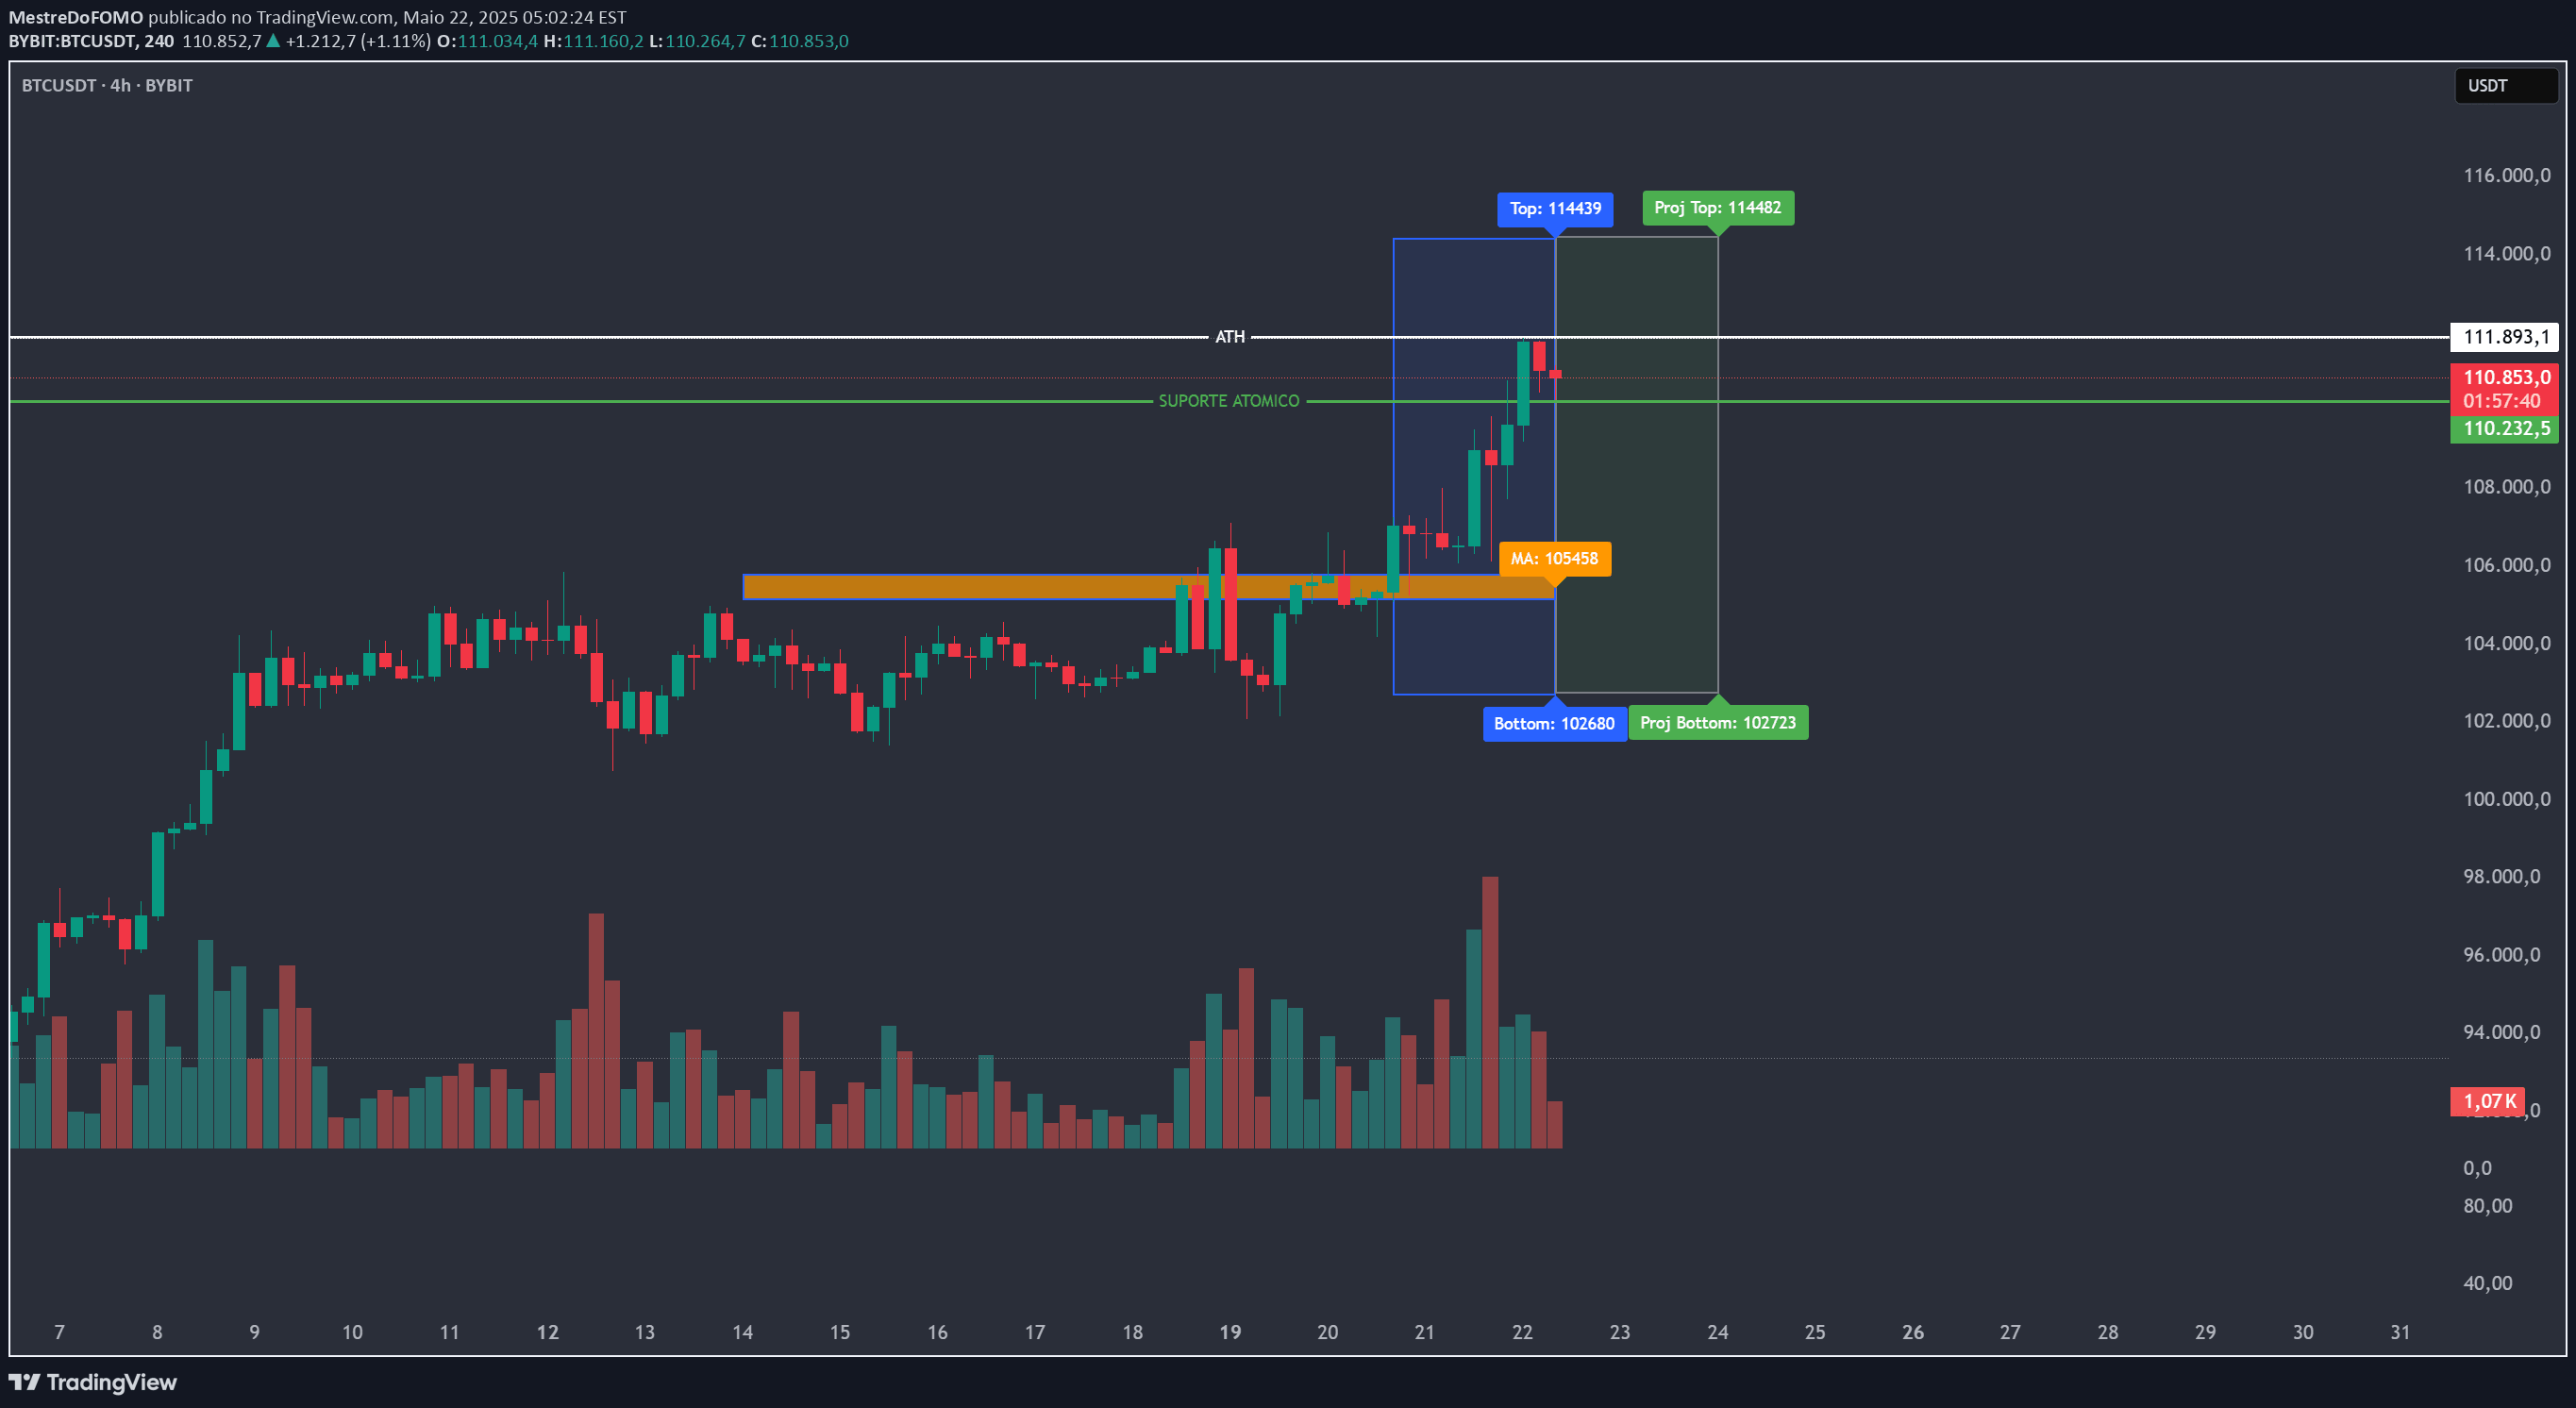
A dynamic Renko chart indicator that adapts to market volatility, creating price movement bricks and providing trend reversal signals with support and resistance channels.
Explore complementary indicator rolesHow it works
The MestreDoFOMO Renko Underground indicator creates dynamic Renko bricks by calculating brick size using Average True Range (ATR) with an adjustable multiplier. This approach adapts to market volatility, generating green or red bricks based on significant price movements, with each brick representing a specific price range independent of time.
The indicator further enhances analysis by drawing support and resistance channels based on the last 10 brick highs and lows, and overlaying a moving average line to help confirm overall trend direction. Reversal signals are marked with triangles, appearing only when the trend shifts, which helps reduce false signals and provides clear visual indicators of potential market direction changes.
Why it may be useful
Renko charts offer traders a unique perspective on price movement by filtering out market noise and focusing solely on significant price changes. By eliminating time-based constraints, traders can more easily identify true market trends and potential reversal points, making complex market dynamics more transparent and comprehensible.
The adaptive nature of the indicator, using ATR to dynamically adjust brick size, ensures that the analysis remains relevant across different market conditions and asset types. This flexibility, combined with built-in support and resistance channels and moving average tracking, provides traders with a comprehensive tool for understanding market behavior and making more informed trading decisions.
When to explore it
The MestreDoFOMO Renko Underground is most effective when trading volatile assets with significant price movements, such as cryptocurrencies, forex, or stocks with high trading volumes. It performs exceptionally well on multiple timeframes, from 1-hour to daily charts, allowing traders to adapt the indicator's settings to match the specific characteristics of their chosen asset.
Traders should consider using this indicator in conjunction with other technical analysis tools to confirm signals and develop robust trading strategies. It is particularly useful during trending markets, where clear directional movements can be more easily identified, and when looking to minimize the impact of short-term market noise on trading decisions.
Keep exploring
What we’ve verified
Access, alerts and repainting behaviour have not been independently verified for this indicator. Check the creator’s current publication and settings.
General descriptions and classifications are recovered research. Verified details above identify the specific checks we have completed. Check the creator’s current publication for later changes.