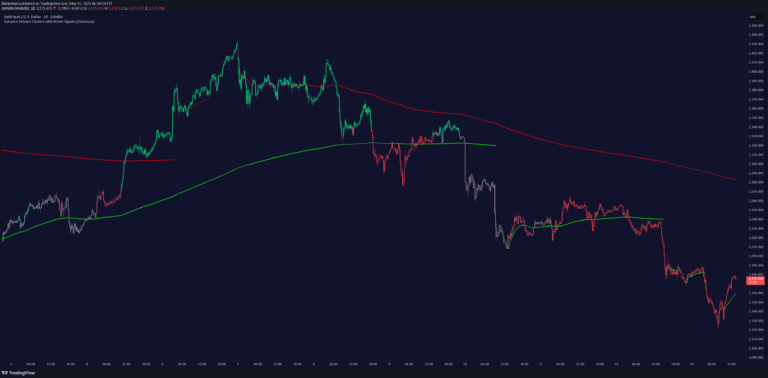
A trading signal that uses Bollinger Bands and volume analysis to detect market maker aggression, panic selling, and potential trading opportunities through visual and volume-based indicators.
Explore complementary indicator rolesHow it works
The signal first calculates and plots Bollinger Bands around price action, creating upper and lower bands that represent potential volatility boundaries. These bands dynamically adjust based on price movement and standard deviation, helping traders identify when price moves outside normal ranges.
Simultaneously, the indicator performs volume analysis by comparing current trading volume against historical average volume. When volume spikes beyond a predefined threshold, the background color changes to orange, signaling potential market maker intervention or significant market sentiment shifts.
Why it may be useful
Market makers play a crucial role in price discovery and liquidity, and understanding their potential actions can provide traders with valuable insights into market dynamics. By monitoring volume spikes and price movements relative to Bollinger Bands, traders can detect potential aggressive buying or panic selling scenarios before they become widely apparent.
The signal helps traders identify potential trend reversals, breakout opportunities, and moments of market uncertainty by combining volatility and volume analysis. This comprehensive approach allows for more informed trading decisions and can help traders anticipate and react to sudden market movements.
When to explore it
This signal works best in markets with significant liquidity and active trading volumes, such as major stock indices, forex pairs, and highly traded commodities. It is particularly effective during periods of market uncertainty, earnings announcements, economic news releases, and other events that can trigger sudden price movements.
Traders should pay special attention to the signal during the first and last hours of trading when market volatility tends to be highest. It is most suitable for short-term trading strategies like scalping and day trading, where quick identification of market maker aggression can provide a competitive edge.
Keep exploring
What we’ve verified
Access, alerts and repainting behaviour have not been independently verified for this indicator. Check the creator’s current publication and settings.
General descriptions and classifications are recovered research. Verified details above identify the specific checks we have completed. Check the creator’s current publication for later changes.