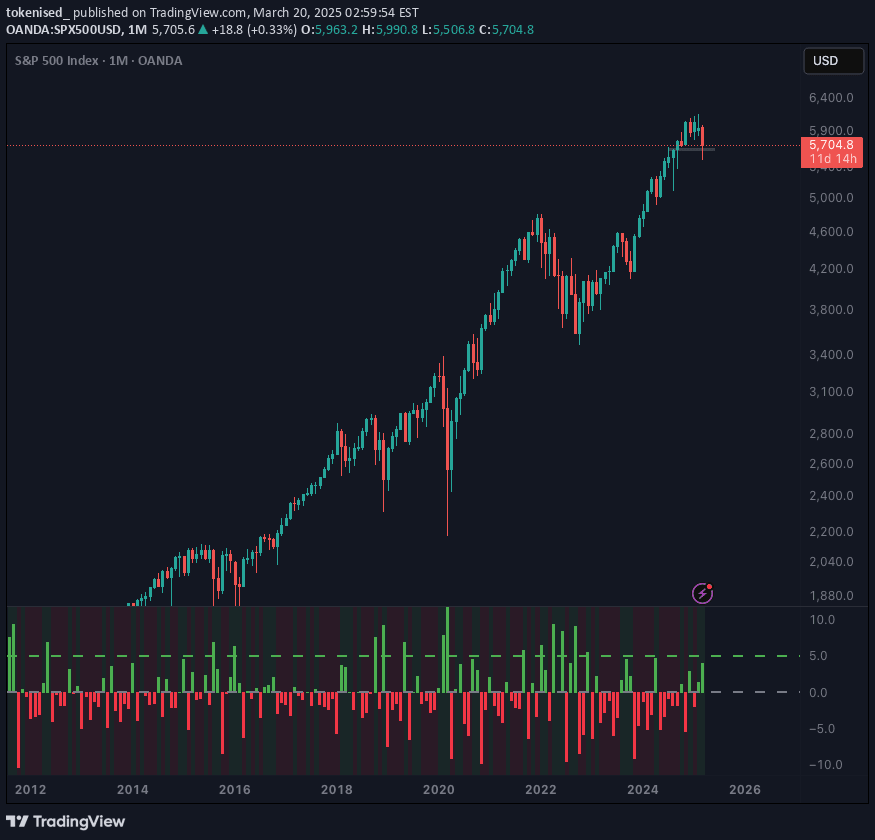
A macroeconomic indicator that compares M2 money supply growth with S&P 500 performance to identify potential market turning points and liquidity trends.
Explore complementary indicator rolesHow it works
The Money Flow Divergence Indicator calculates growth rates for both the S&P 500 index and U.S. M2 money supply. It compares these two metrics to determine the growth gap between market performance and economic liquidity.
Green bars indicate M2 growth exceeding stock market growth, while red bars show stock market growth outpacing liquidity. The indicator uses a zero line to help traders distinguish between positive and negative growth trends, providing a visual representation of economic liquidity conditions
Why it may be useful
This indicator offers crucial insights into the relationship between market performance and economic liquidity. By tracking the divergence between money supply and stock market growth, traders can anticipate potential market turning points.
It provides a macro-level view of economic conditions that can help investors make more informed decisions. The indicator reveals whether current market valuations are supported by underlying economic liquidity, potentially highlighting overvaluation or undervaluation
When to explore it
The Money Flow Divergence Indicator is most effective for long-term investors and macro traders analyzing broad economic cycles. It works best on monthly timeframes, providing strategic insights rather than short-term trading signals.
Ideal for portfolio managers assessing market conditions, swing traders looking for macro trends, and investors seeking to understand the broader economic context of market movements. Use it to identify potential market turning points and assess the underlying economic support for current market valuations
Keep exploring
What we’ve verified
Access, alerts and repainting behaviour have not been independently verified for this indicator. Check the creator’s current publication and settings.
General descriptions and classifications are recovered research. Verified details above identify the specific checks we have completed. Check the creator’s current publication for later changes.