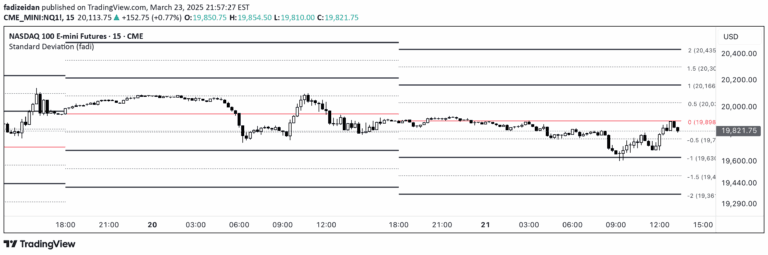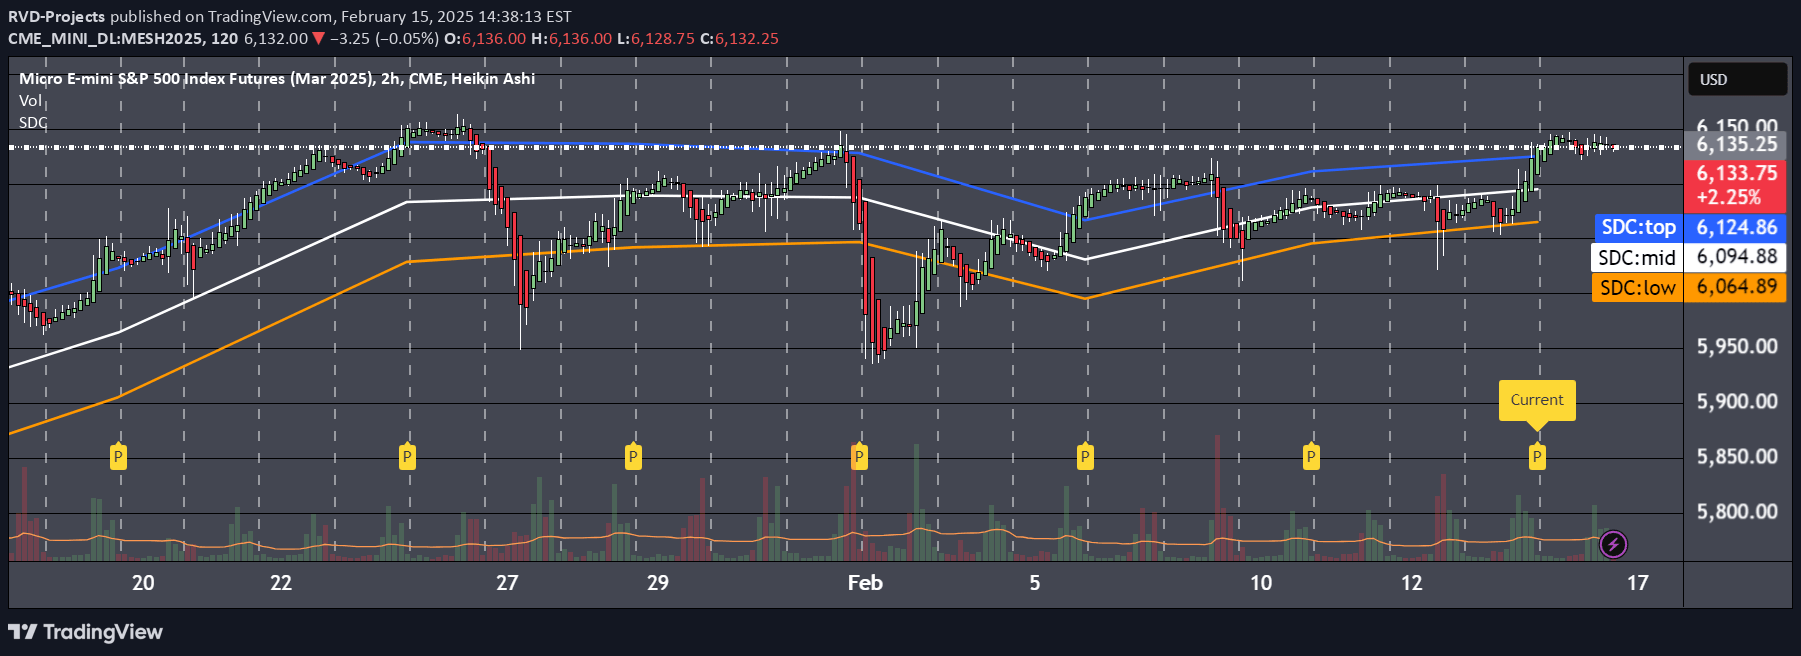
Standard deviation is a statistical tool measuring the dispersion of data points from the mean, indicating how much prices deviate from an average in financial markets.
Explore complementary indicator rolesHow it works
Standard deviation calculates the spread of data points around the mean by first determining the average value in a dataset and then measuring how far individual points are from that central value. It involves squaring the differences between each data point and the mean, calculating the average of those squared differences (variance), and then taking the square root of that value.
In financial analysis, standard deviation helps traders understand price volatility by revealing how much an asset's price deviates from its average. A higher standard deviation indicates more significant price fluctuations, while a lower value suggests more stable and consistent price movements.
Why it may be useful
Standard deviation provides traders with critical insights into market volatility and potential investment risks by quantifying price variations around a central point. It helps investors assess the predictability and stability of an asset, enabling more informed decision-making about potential investments and trading strategies.
By understanding standard deviation, traders can better manage risk, set appropriate stop-loss levels, and identify potential market opportunities. It serves as a valuable tool for comparing different securities, understanding historical price behavior, and developing more robust trading and investment approaches.
When to explore it
Standard deviation is most effective when analyzing securities with significant price movements or during periods of market uncertainty. Traders can use it to evaluate the consistency of an asset's performance, identify potential trend changes, and assess the reliability of price patterns.
It is particularly useful when comparing different investment options, developing risk management strategies, and understanding the potential range of price fluctuations. Investors can apply standard deviation across various timeframes, from short-term day trading to long-term investment analysis, making it a versatile tool for comprehensive market assessment.
Keep exploring
What we’ve verified
Access, alerts and repainting behaviour have not been independently verified for this indicator. Check the creator’s current publication and settings.
General descriptions and classifications are recovered research. Verified details above identify the specific checks we have completed. Check the creator’s current publication for later changes.