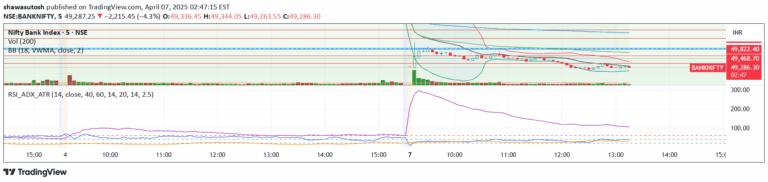
A multi-indicator dashboard combining price change, RSI, ATR, Alligator, and Supertrend across multiple timeframes to provide comprehensive market analysis and momentum insights.
Explore complementary indicator rolesHow it works
The Multi IND Dashboard integrates multiple technical indicators to analyze market dynamics comprehensively. Each indicator calculates specific metrics: price change tracks candlestick movement, RSI measures momentum, ATR assesses volatility, Alligator identifies trend direction, and Supertrend confirms trend strength.
These indicators use default settings like 14-period lengths and specific calculations to generate signals. The dashboard displays color-coded results, allowing traders to quickly interpret market conditions across up to 10 different timeframes and understand the underlying price momentum and trend characteristics.
Why it may be useful
Technical traders require comprehensive market analysis tools that provide nuanced insights beyond single-indicator approaches. This dashboard synthesizes multiple indicators, offering a holistic view of market conditions by simultaneously tracking momentum, trend strength, and price volatility.
By integrating diverse indicators, traders can make more informed decisions, reducing reliance on single-metric analysis. The multi-indicator approach helps identify potential entry and exit points, understand market sentiment, and develop more robust trading strategies across various market conditions.
When to explore it
The Multi IND Dashboard is most effective during periods of clear market trends and when seeking multi-dimensional market analysis. It works exceptionally well in markets with consistent momentum and discernible trend patterns, helping traders identify potential trade opportunities across different timeframes.
Traders should utilize this dashboard when they want to confirm signals across multiple technical indicators, validate trend strength, and gain a comprehensive understanding of market dynamics. It is particularly useful for traders who prefer data-driven, systematic approaches to market analysis and want to minimize emotional decision-making.
Keep exploring
What we’ve verified
Access, alerts and repainting behaviour have not been independently verified for this indicator. Check the creator’s current publication and settings.
General descriptions and classifications are recovered research. Verified details above identify the specific checks we have completed. Check the creator’s current publication for later changes.