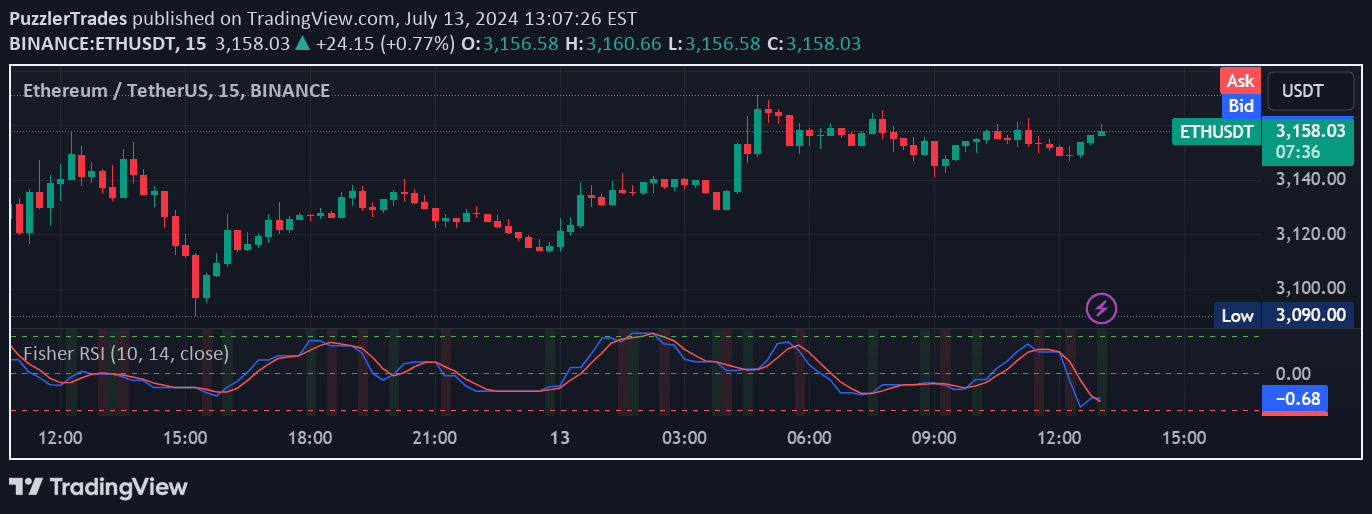
The Fisher Transform converts price data into a normalized oscillator, helping traders identify momentum shifts and potential trend reversals across multiple timeframes.
Explore complementary indicator rolesHow it works
The Fisher Transform uses mathematical principles to convert price data into a normalized oscillator that reveals momentum characteristics. It calculates the lowest low and highest high over a specified period, then applies a complex transformation that converts price into a bell-curve-like oscillating signal.
By normalizing price data, the indicator helps traders understand when price movements are becoming extreme or potentially reversing. The transformation compresses price information into a more readable format, allowing traders to see momentum shifts more clearly than traditional price charts.
Why it may be useful
The Fisher Transform provides traders with a unique perspective on market momentum by transforming raw price data into a more interpretable signal. It helps identify potential trend reversals and moments of price extremity that might not be immediately apparent on standard price charts.
By offering insights across multiple timeframes, the indicator allows traders to understand momentum dynamics from different perspectives. This multi-timeframe approach enables more comprehensive market analysis and can help traders make more informed trading decisions.
When to explore it
The Fisher Transform works best in markets with clear trending or ranging characteristics, where momentum shifts are more pronounced and identifiable. It is particularly effective when used in conjunction with other technical indicators to confirm potential trade signals and validate momentum changes.
Traders should apply the Fisher Transform across different timeframes to gain a comprehensive view of market dynamics. It is most useful in liquid markets with consistent price movements, such as major forex pairs, stock indices, and actively traded commodities.
Keep exploring
What we’ve verified
Access, alerts and repainting behaviour have not been independently verified for this indicator. Check the creator’s current publication and settings.
General descriptions and classifications are recovered research. Verified details above identify the specific checks we have completed. Check the creator’s current publication for later changes.