
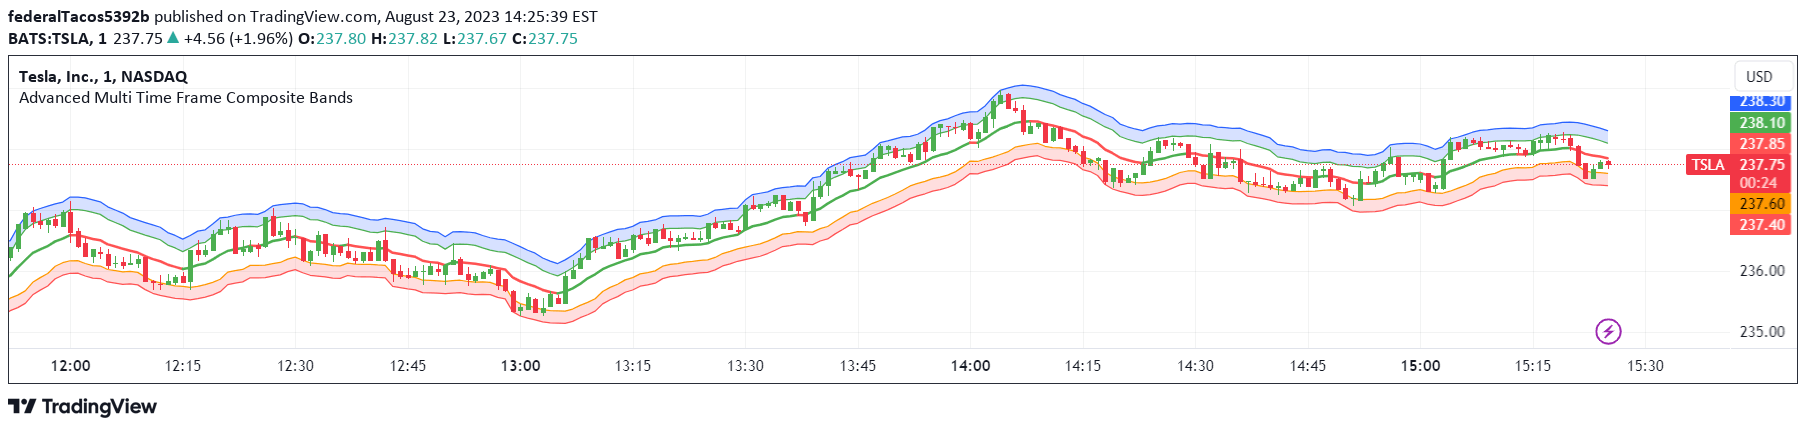
A multi-timeframe indicator using Fibonacci periods to create dynamic price bands that track market movements and potential reversals without traditional volatility metrics.
Explore complementary indicator rolesHow it works
The Multi Time Frame Composite Bands utilize Fibonacci numbers (5, 8, 13, 21, 34) as period lengths for price calculations. It creates a composite high line (C_high) by averaging the highest prices over these Fibonacci periods and incorporating simple moving averages of high prices for smoothing and refinement.
Similarly, a composite low line (C_low) is calculated by averaging the lowest prices with moving averages of low prices. The midline is derived from the mean of C_high and C_low, creating a dynamic price channel that adapts to market conditions without relying on traditional volatility measures.
Why it may be useful
This indicator provides traders with a unique perspective on price movements by creating adaptive bands that closely track market dynamics. Unlike traditional volatility indicators like Bollinger Bands or ATR bands, it uses a more nuanced approach to identifying potential price ranges and market conditions.
By utilizing Fibonacci periods and moving averages, the indicator offers a smoother, more responsive method of tracking price movements. Traders can gain insights into potential trend strengths, market volatility, and possible reversal points without the complexity of standard deviation or average true range calculations.
When to explore it
The Multi Time Frame Composite Bands are most effective during trending markets where price movements show clear directional momentum. Traders can use this indicator to identify potential entry and exit points when price candles interact with the bands, particularly when entire candles move outside the defined range.
It is particularly useful for traders seeking a more adaptive alternative to traditional volatility indicators. The bands can help identify potential price corrections or reversals, making it valuable for various trading styles including scalping, day trading, and swing trading across different financial instruments and timeframes.
Keep exploring
What we’ve verified
Access, alerts and repainting behaviour have not been independently verified for this indicator. Check the creator’s current publication and settings.
General descriptions and classifications are recovered research. Verified details above identify the specific checks we have completed. Check the creator’s current publication for later changes.


