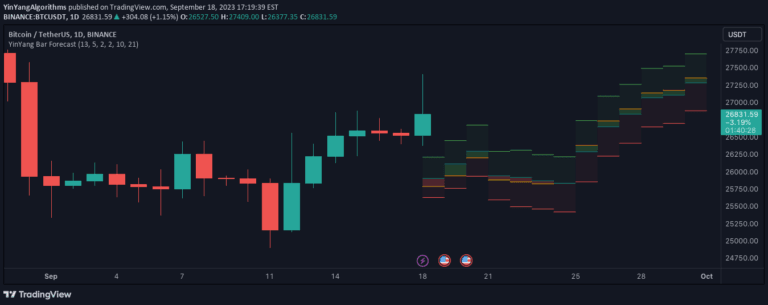
A dynamic indicator that calculates percentage changes between consecutive bars, providing insights into price behavior and potential trend movements across different market conditions.
Explore complementary indicator rolesHow it works
The NEXT BAR Percentages Indicator analyzes price changes by calculating multiple percentage variations between consecutive bars, including close-to-close, high-to-close, and low-to-close comparisons. It generates detailed statistical insights by tracking positive and negative percentage change occurrences and computing their averages.
The indicator creates a dynamic table displaying these percentage change calculations and plots visual labels on the chart to highlight significant price movements. Traders can customize input parameters like high positive and negative thresholds and specify a start date for focused analysis.
Why it may be useful
By providing granular insights into price movement percentages, this indicator helps traders understand market dynamics and potential trend shifts more comprehensively. It transforms raw price data into actionable statistical information, allowing traders to recognize patterns and make more informed trading decisions.
The multi-dimensional percentage change analysis enables traders to assess market volatility, momentum, and potential trend reversals with greater precision. Its customizable nature allows adaptation to different trading styles and market conditions, making it a versatile tool for technical analysis.
When to explore it
The NEXT BAR Percentages Indicator is most effective during periods of significant price volatility or when traders want to analyze precise percentage changes in market movements. It works particularly well in markets with clear directional trends or when seeking to understand the statistical likelihood of price continuation or reversal.
Traders can leverage this indicator across various timeframes, from scalping to swing trading, by adjusting the threshold parameters. It is especially useful when combined with other technical analysis tools to confirm signals and provide additional context to trading strategies.
Keep exploring
What we’ve verified
Access, alerts and repainting behaviour have not been independently verified for this indicator. Check the creator’s current publication and settings.
General descriptions and classifications are recovered research. Verified details above identify the specific checks we have completed. Check the creator’s current publication for later changes.