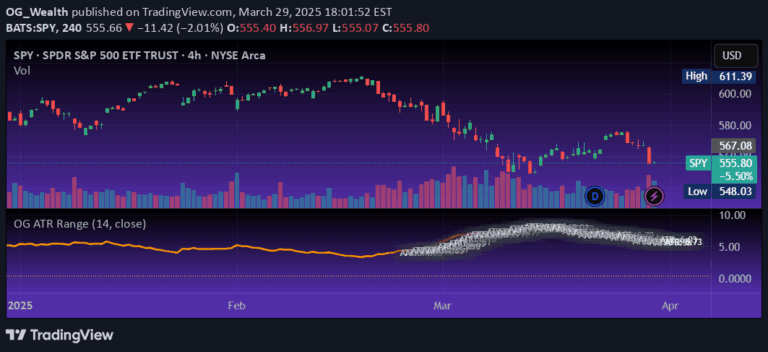
An EMA-smoothed ATR indicator that visualizes potential price movement range by plotting opening price with upper and lower volatility lines for quick market analysis.
Explore complementary indicator rolesHow it works
The indicator calculates the Exponential Moving Average (EMA) of the Average True Range (ATR) to create a dynamic price movement visualization. It plots three key lines: a green opening price line and two blue lines representing the upper and lower volatility boundaries.
These blue lines are created by adding and subtracting the EMA-smoothed ATR value from the opening price, providing traders with a visual representation of potential price fluctuation range. The EMA smoothing helps reduce noise and provide a more stable volatility measurement compared to standard ATR calculations.
Why it may be useful
This indicator offers traders a quick and intuitive method to understand potential price movement and market volatility within a specific timeframe. By visualizing the opening price alongside potential upper and lower boundaries, traders can make more informed decisions about market direction and potential breakout points.
The EMA-smoothed ATR provides a refined volatility measurement that helps traders assess market conditions more accurately. This approach allows for better risk management, stop-loss placement, and identifying potential entry and exit points across different trading scenarios.
When to explore it
The indicator is most effective in markets with clear directional movements and moderate to high volatility. Traders can utilize this tool during periods of potential breakouts, when seeking to understand the potential price range for a specific timeframe.
It is particularly useful for short-term trading strategies, such as scalping and day trading, where quick volatility assessment is crucial. Traders should combine this indicator with other technical analysis tools to confirm signals and make more comprehensive trading decisions.
Keep exploring
What we’ve verified
Access, alerts and repainting behaviour have not been independently verified for this indicator. Check the creator’s current publication and settings.
General descriptions and classifications are recovered research. Verified details above identify the specific checks we have completed. Check the creator’s current publication for later changes.