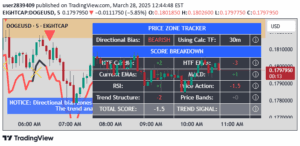
Opening Range Breakout (ORB) is an intraday trading strategy that identifies potential price movements by analyzing the market's initial trading range within a specific time period.
Explore complementary indicator rolesHow it works
The Opening Range Breakout (ORB) strategy works by establishing a specific time range at the market's opening, typically within the first 30-60 minutes of trading. Traders define a session start time and calculate the price range during this initial period. Once the range is established, the indicator watches for price movement beyond this range, which can signal a potential trading opportunity.
If the price breaks above or below the initial range, it suggests momentum and potential trend direction. Traders use this breakout as a trigger to enter long or short positions. The strategy requires precise time zone and market session settings to be effective
Why it may be useful
The ORB strategy is valuable because it helps traders capture early market momentum and identify potential trend reversals. By focusing on the initial trading range, it provides insights into market sentiment and potential price movements. This approach allows traders to make more informed decisions based on the market's early dynamics.
The indicator helps reduce emotional trading by providing a systematic entry method. It can be particularly useful in volatile markets where early price action can be indicative of broader market trends. The strategy works across different financial instruments and can be adapted to various trading styles
When to explore it
The Opening Range Breakout is most effective during active trading sessions with high liquidity, such as major stock market hours. It works best for intraday trading on timeframes less than one day, including 1-minute, 5-minute, and hourly charts. Traders should use this strategy on liquid markets like major stock indices, futures, and actively traded stocks.
The indicator is particularly useful during the first hour of trading when market volatility and volume are typically highest. It may be less reliable during low-volume periods or during significant economic announcements. Traders should combine ORB with other technical analysis tools for confirmation
Keep exploring
What we’ve verified
Access, alerts and repainting behaviour have not been independently verified for this indicator. Check the creator’s current publication and settings.
General descriptions and classifications are recovered research. Verified details above identify the specific checks we have completed. Check the creator’s current publication for later changes.