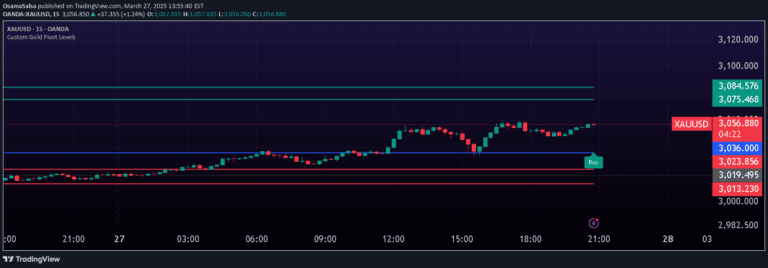
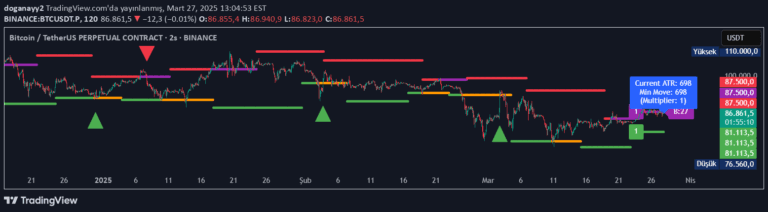
An advanced charting tool that visualizes key price levels across daily, weekly, and monthly timeframes, helping traders identify critical support, resistance, and market trends.
Explore complementary indicator rolesHow it works
The Overlay-Chart Indicator uses request.security function to fetch historical and current price data, analyzing open, low, high, close, and equilibrium levels for different timeframes. It generates dynamic lines that extend into future bars, providing traders with visual projections of key price points.
The script draws these critical levels using customizable colors and labels, allowing traders to quickly interpret market structure. By plotting daily, weekly, and monthly price levels, the indicator creates a comprehensive view of potential support and resistance zones that can guide trading decisions.
Why it may be useful
This indicator provides traders with a multi-dimensional view of market dynamics, transforming complex price data into easily digestible visual information. By displaying multiple timeframe levels simultaneously, traders can gain deeper insights into market trends, potential reversal points, and overall price momentum.
The tool's ability to project future levels helps traders anticipate potential market movements, making it an invaluable resource for developing strategic entry and exit points. Its flexibility in customization allows traders to adapt the indicator to their specific trading style and preferences.
When to explore it
The Overlay-Chart Indicator is most effective for traders seeking precise, data-driven insights into market structure, particularly during volatile or trending market conditions. It is especially valuable for scalpers and day traders who need rapid, accurate assessments of price levels and potential market movements.
Traders should utilize this indicator when analyzing markets with clear directional trends or when preparing for potential breakout or breakdown scenarios. Its multi-timeframe approach makes it particularly useful during periods of market transition or when seeking to confirm potential trading signals across different temporal perspectives.
Keep exploring
What we’ve verified
Access, alerts and repainting behaviour have not been independently verified for this indicator. Check the creator’s current publication and settings.
General descriptions and classifications are recovered research. Verified details above identify the specific checks we have completed. Check the creator’s current publication for later changes.