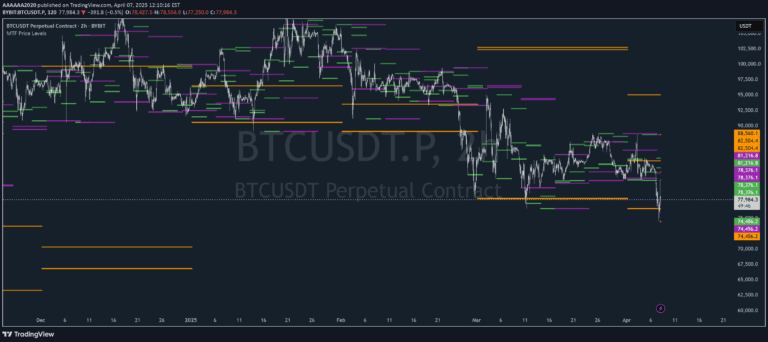
An advanced trendline projection indicator that automatically generates parallel lines from a single anchor point, helping traders identify dynamic support and resistance levels across different timeframes.
Explore complementary indicator rolesHow it works
The indicator creates parallel trendlines by selecting a specific anchor point such as a swing high, swing low, or highest/lowest price within a defined lookback period. Users can customize the projection by setting parameters like angle degree, projection ratio, and number of lines to generate.
Once the anchor point is selected, the indicator mathematically extends lines at the specified angle and distance, creating a dynamic channel that adapts to the chosen market and timeframe. The lines can be projected upwards or downwards, providing traders with a flexible tool for visualizing potential price movement trajectories.
Why it may be useful
Parallel trendline projections offer traders a systematic approach to identifying potential support and resistance levels beyond traditional static analysis. By dynamically generating multiple lines from a single anchor point, traders can gain insights into potential price corridors and movement patterns that might not be immediately visible.
The indicator's flexibility allows traders to adapt to different market conditions by adjusting parameters like angle and projection ratio. This customization enables a more nuanced understanding of price dynamics, helping traders make more informed decisions about potential entry, exit, and trend continuation points.
When to explore it
The indicator works best in markets with clear directional trends and relatively consistent price movements, such as forex, futures, and certain stock indices. Traders should use it in conjunction with other technical analysis tools to confirm potential trade setups and validate the projected channel's reliability.
It is particularly useful for identifying potential breakout and pullback opportunities, as the parallel lines can help traders anticipate where price might find support or resistance. The indicator's effectiveness increases when used across multiple timeframes and combined with volume and momentum indicators to enhance trade probability.
Keep exploring
What we’ve verified
Access, alerts and repainting behaviour have not been independently verified for this indicator. Check the creator’s current publication and settings.
General descriptions and classifications are recovered research. Verified details above identify the specific checks we have completed. Check the creator’s current publication for later changes.