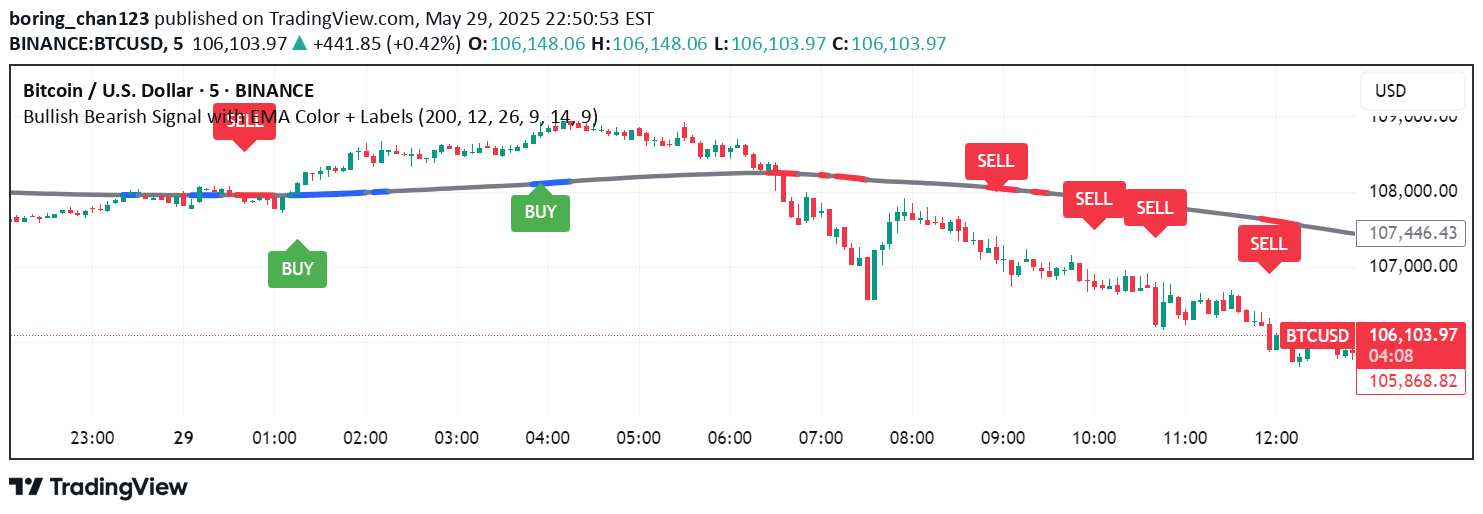
A dynamic trading strategy combining Bollinger Bands, RSI, and market structure to identify high-probability buy and sell signals aligned with prevailing market trends.
Explore complementary indicator rolesHow it works
The strategy employs Bollinger Bands to define price volatility boundaries, with upper and lower bands marking potential trading zones. The middle band represents a 20-period simple moving average, providing a baseline for price movement. RSI is used to confirm momentum, identifying overbought and oversold conditions to validate potential entry points.
Market structure analysis tracks swing highs and lows to determine trend direction, using color-coded backgrounds to indicate uptrends or downtrends. Buy signals are generated when price crosses above the lower Bollinger Band during an uptrend and RSI is oversold, while sell signals occur when price crosses below the upper Bollinger Band during a downtrend with RSI showing overbought conditions.
Why it may be useful
This multi-indicator approach provides traders with a comprehensive view of market dynamics, combining volatility, momentum, and trend analysis to improve signal accuracy and reduce false entries. By integrating multiple technical indicators, traders can make more informed decisions that account for different market aspects simultaneously.
The strategy's strength lies in its ability to filter out low-probability trades by requiring confirmation from multiple technical indicators. This approach helps traders minimize risk by ensuring that signals align with overall market trend, momentum, and volatility conditions, ultimately leading to more precise and potentially more profitable trading decisions.
When to explore it
The strategy is most effective in trending markets with clear directional movement, where price consistently forms higher lows in uptrends or lower highs in downtrends. It works best in markets with sufficient volatility to create meaningful Bollinger Band expansions and contractions, allowing for more reliable signal generation.
Traders should be cautious about using this strategy in choppy or sideways markets, where signals may be less reliable and require additional confirmation. The ideal application is in markets with strong, identifiable trends across various timeframes, particularly in day trading and swing trading scenarios where intermediate-term price movements can be captured more effectively.
Keep exploring
What we’ve verified
Access, alerts and repainting behaviour have not been independently verified for this indicator. Check the creator’s current publication and settings.
General descriptions and classifications are recovered research. Verified details above identify the specific checks we have completed. Check the creator’s current publication for later changes.