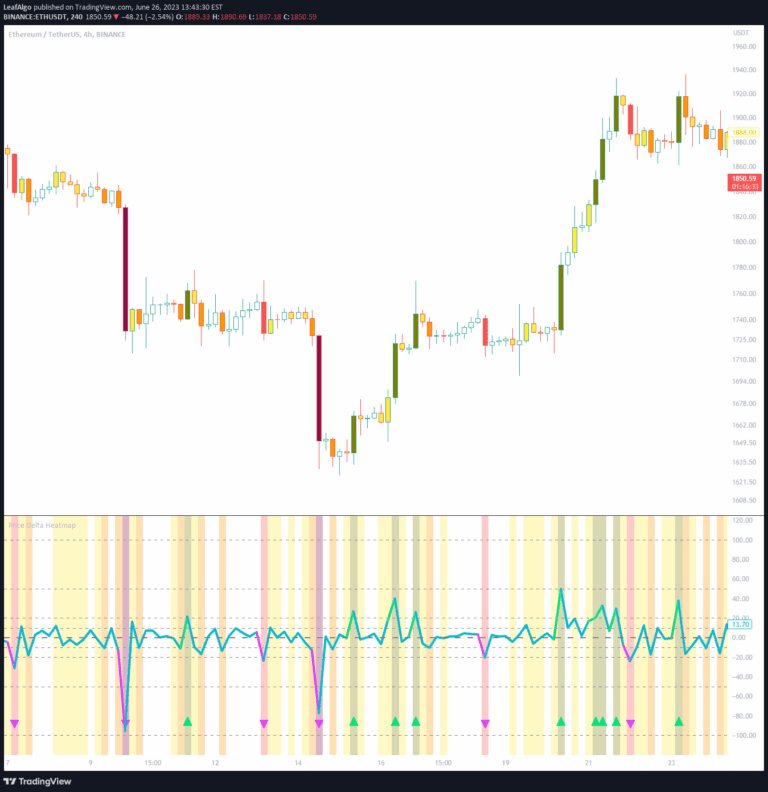
A trading indicator that visualizes market momentum through a dynamic histogram, highlighting significant candle size changes and potential volatility shifts for traders.
Explore complementary indicator rolesHow it works
The PC - Hantu Galah indicator operates by analyzing candle size dynamics and comparing current price movement to historical patterns. It creates a histogram that tracks the size of current candles, providing a visual representation of market momentum and potential volatility changes.
The core mechanism involves comparing the current candle's size to previous candle sizes, specifically checking if the current candle exceeds 22 points and is larger than the candle from 20 periods back. When these conditions are met, the histogram turns blue, signaling a potential significant market movement or momentum shift.
Why it may be useful
The indicator simplifies complex market analysis by translating price movement data into an easy-to-understand visual format. By highlighting moments of heightened market activity, traders can quickly identify potential trading opportunities without getting lost in intricate technical details.
Its dynamic color-coding system provides an intuitive way to recognize significant momentum changes, allowing traders to make more informed decisions. The visual representation helps traders quickly assess market conditions, potentially reducing the time and cognitive load required for comprehensive market analysis.
When to explore it
This indicator is most effective in markets with active price movements and clear momentum shifts. Traders can utilize it during periods of potential breakouts, trend reversals, or when seeking to identify rapid changes in market sentiment.
It works best in timeframes that capture short to medium-term price dynamics, such as intraday and scalping scenarios. Traders should combine this indicator with other technical analysis tools to confirm signals and develop a comprehensive trading strategy.
Keep exploring
What we’ve verified
Access, alerts and repainting behaviour have not been independently verified for this indicator. Check the creator’s current publication and settings.
General descriptions and classifications are recovered research. Verified details above identify the specific checks we have completed. Check the creator’s current publication for later changes.