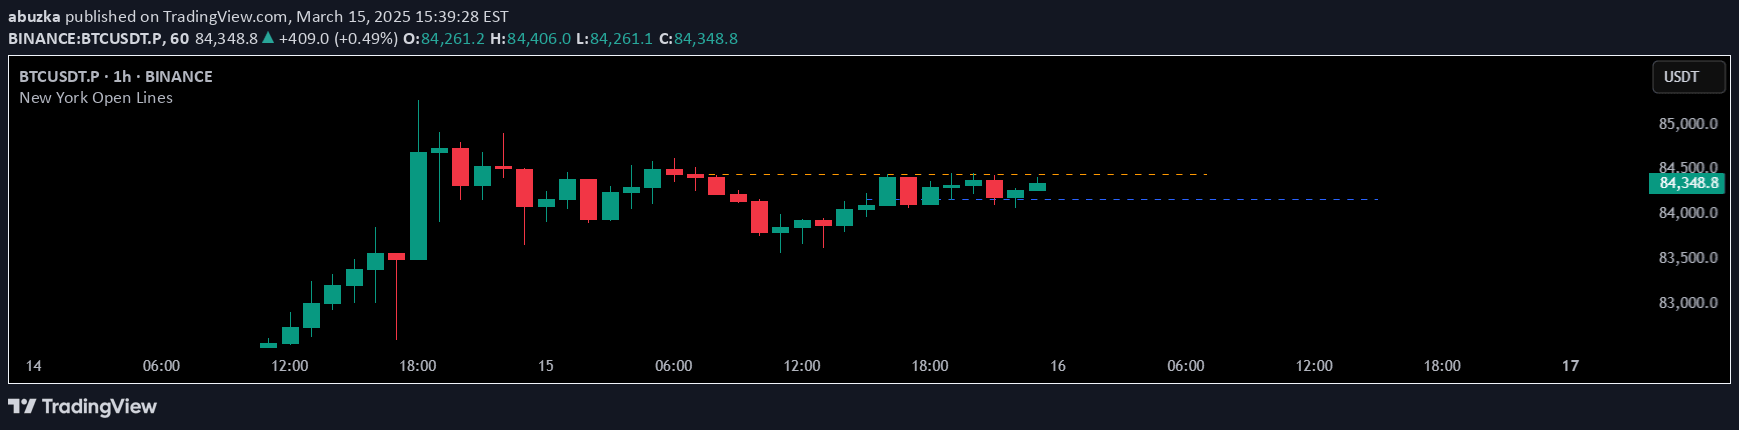
A pre-market trading tool that draws dynamic high and low levels from 4:00 AM to 9:30 AM ET, providing crucial reference points for intraday trading strategies.
Explore complementary indicator rolesHow it works
The Pre-Market Range signal captures the highest and lowest price levels during the pre-market trading session, specifically from 4:00 AM to 9:30 AM ET. It utilizes precise 1-minute intraday data to plot accurate horizontal lines that remain locked in place after the market opens.
These lines are designed to remain visible across multiple timeframes, including 1-minute, 5-minute, 15-minute, 1-hour, 4-hour, and daily charts. The tool automatically generates price labels to help traders easily reference the exact pre-market levels. Once established at 9:30 AM, these lines remain static and visible even when switching between different timeframes or disabling extended hours trading.
Why it may be useful
The Pre-Market Range signal provides traders with critical insights into market sentiment and potential price movements before the regular trading session begins. By identifying key pre-market high and low levels, traders can develop more informed entry and exit strategies, helping to manage risk and capitalize on potential breakout opportunities.
These static lines serve as important reference points for understanding market dynamics and potential support and resistance zones. The tool's ability to maintain visibility across multiple timeframes makes it a versatile resource for traders seeking to make more precise and strategic trading decisions. By offering a clear view of pre-market price action, traders can better anticipate potential market movements and adjust their trading plans accordingly.
When to explore it
The Pre-Market Range signal is most effective for day traders and scalpers who need precise insights into early market movements and potential trading opportunities. It is particularly valuable during volatile market conditions or when significant economic news might impact price action. Traders can use these levels to identify potential breakout points, set stop-loss orders, and develop more targeted trading strategies.
The signal works best when combined with other technical analysis tools and fundamental market research. Traders should pay special attention to how the pre-market levels interact with subsequent price action, using them as reference points for making informed trading decisions throughout the day.
Keep exploring
What we’ve verified
Access, alerts and repainting behaviour have not been independently verified for this indicator. Check the creator’s current publication and settings.
General descriptions and classifications are recovered research. Verified details above identify the specific checks we have completed. Check the creator’s current publication for later changes.