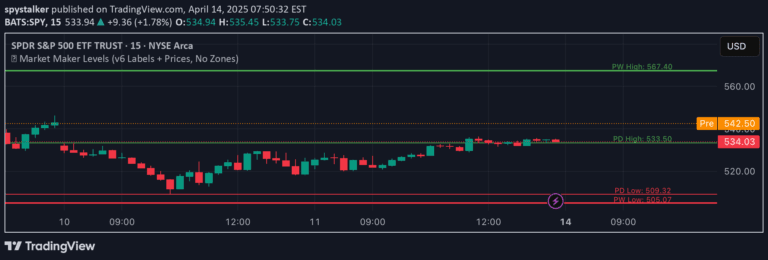
A trading indicator that highlights the previous week's high, low, and midpoint levels to help traders identify key support and resistance zones for strategic decision-making.
Explore complementary indicator rolesHow it works
The Previous Week High & Low Indicator operates by automatically calculating the high and low price levels from the previous trading week. It uses a weekly timeframe with a lookahead mode to ensure these levels remain static after the week's close, providing traders with consistent reference points.
The indicator plots these levels as step lines, visible only during active trading days from Monday to Friday. A white midpoint line is also calculated between the high and low, serving as a potential psychological pivot point for market participants to assess price action and potential market movements.
Why it may be useful
This indicator simplifies chart analysis by providing clear, objective reference levels derived from recent market performance. By highlighting previous week's extreme price points, traders can quickly identify potential support and resistance zones without manual calculations.
The visual representation helps traders make more informed decisions about entry, exit, and stop-loss placements. The midpoint line adds an additional layer of insight, offering a balanced perspective on recent price action and potential market sentiment.
When to explore it
The Previous Week High & Low Indicator is most effective in markets with consistent trading patterns and recognizable support and resistance levels. It works particularly well for traders who rely on historical price dynamics and seek to understand recent market movements.
This tool is versatile across different timeframes and assets, making it suitable for various trading strategies. Traders can benefit from its insights during trending markets, range-bound conditions, and when looking to confirm potential breakout or reversal scenarios.
Keep exploring
What we’ve verified
Access, alerts and repainting behaviour have not been independently verified for this indicator. Check the creator’s current publication and settings.
General descriptions and classifications are recovered research. Verified details above identify the specific checks we have completed. Check the creator’s current publication for later changes.