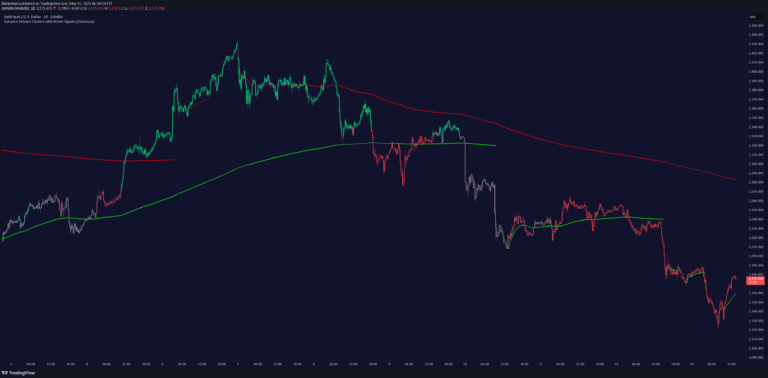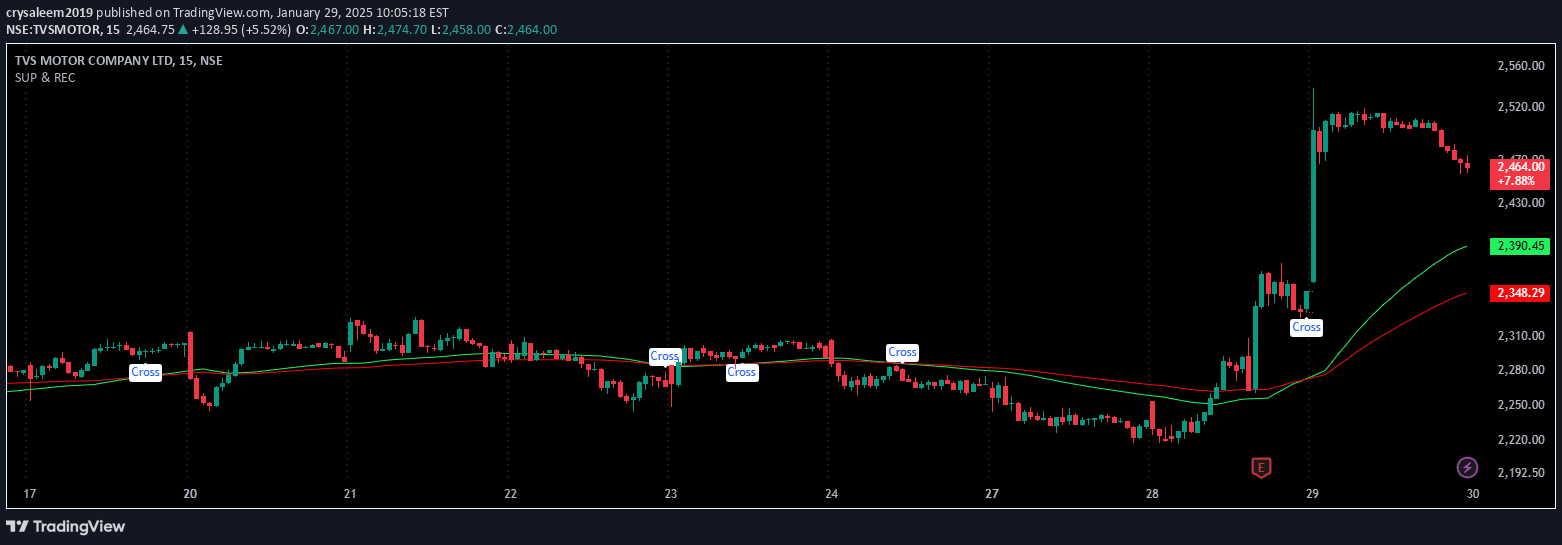
A visual indicator highlighting key price levels where an asset historically struggles to break through, helping traders identify potential support and resistance zones on a chart.
Explore complementary indicator rolesHow it works
Support and resistance indicators analyze historical price movements to identify key levels where an asset's price tends to pause or reverse. These levels are typically created by previous price congestion, peaks, and troughs that represent psychological barriers for traders.
The indicator plots horizontal or dynamic lines on the chart representing zones where buying or selling pressure has historically been strong. By examining these levels, traders can anticipate potential price reactions, including bounces off support, rejections at resistance, or potential breakout scenarios.
Why it may be useful
Support and resistance levels provide critical insights into market psychology and potential price movements, helping traders make more informed trading decisions. These levels reveal areas where significant market participants have previously entered or exited positions, creating natural turning points in price action.
Understanding these key levels allows traders to identify potential entry and exit points, set more precise stop-loss and take-profit orders, and gauge the overall strength of current price trends. By recognizing these important zones, traders can develop more strategic and disciplined trading approaches.
When to explore it
Support and resistance indicators are most effective in markets with clear historical price patterns and sufficient trading volume. They work best in trending markets where price has established consistent levels of support and resistance over multiple time frames.
Traders should use these indicators in conjunction with other technical analysis tools to confirm potential trade setups. They are particularly useful during range-bound markets, when price consistently bounces between established support and resistance zones, providing multiple low-risk trading opportunities.
Keep exploring
What we’ve verified
Access, alerts and repainting behaviour have not been independently verified for this indicator. Check the creator’s current publication and settings.
General descriptions and classifications are recovered research. Verified details above identify the specific checks we have completed. Check the creator’s current publication for later changes.